AT&T Wireless 2015 Annual Report Download - page 20
Download and view the complete annual report
Please find page 20 of the 2015 AT&T Wireless annual report below. You can navigate through the pages in the report by either clicking on the pages listed below, or by using the keyword search tool below to find specific information within the annual report.-
 1
1 -
2
-
3
-
4
-
5
-
6
-
7
-
8
-
9
-
 10
10 -
 11
11 -
 12
12 -
 13
13 -
 14
14 -
 15
15 -
 16
16 -
 17
17 -
 18
18 -
 19
19 -
 20
20 -
 21
21 -
 22
22 -
 23
23 -
 24
24 -
 25
25 -
 26
26 -
 27
27 -
 28
28 -
 29
29 -
 30
30 -
31
-
32
-
33
-
34
-
35
-
36
-
37
-
38
-
39
-
40
-
41
-
42
-
43
-
44
-
45
-
46
-
47
-
48
-
49
-
50
-
51
-
52
-
53
-
54
-
55
-
56
-
57
-
58
-
59
-
60
-
61
-
62
-
63
-
64
-
65
-
66
-
67
-
68
-
69
-
70
-
71
-
72
-
73
-
74
-
75
-
76
-
77
-
78
-
79
-
80
-
81
-
82
-
83
-
84
-
85
-
86
-
87
-
88
 |
 |

Management’s Discussion and Analysis of Financial Condition and Results of Operations (continued)
Dollars in millions except per share amounts
18
|
AT&T INC.
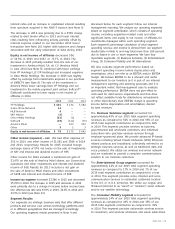
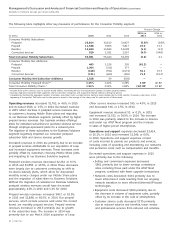
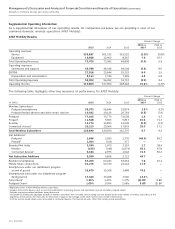
The following table highlights other key measures of performance for the Consumer Mobility segment:
Percent Change
2015 vs. 2014 vs.
(in 000s) 2015 2014 2013 2014 2013
Consumer Mobility Subscribers
Postpaid 28,814 30,610 31,827 (5.9)% (3.8)%
Prepaid 11,548 9,965 5,817 15.9 71.3
Reseller 13,690 13,844 14,028 (1.1) (1.3)
Connected devices1 929 1,021 1,567 (9.0) (34.8)
Total Consumer Mobility Subscribers 54,981 55,440 53,239 (0.8) 4.1
Consumer Mobility Net Additions2
Postpaid 463 1,226 395 (62.2) —
Prepaid 1,364 (311) 377 — —
Reseller (168) (351) (1,074) 52.1 67.3
Connected devices1 (131) (465) (390) 71.8 (19.2)
Consumer Mobility Net Subscriber Additions 1,528 99 (692) — —
Consumer Mobility Postpaid Churn2,3 1.25% 1.22% 1.26% 3 BP (4) BP
Total Consumer Mobility Churn2,3 1.94% 2.06% 1.84% (12) BP 22 BP
1 Includes data-centric devices such as session-based tablets, monitoring devices and automobile systems. Excludes postpaid tablets.
2 Excludes migrations between AT&T segments and/or subscriber categories and acquisition-related additions during the period.
3 Calculated by dividing the aggregate number of wireless subscribers who canceled service during a period divided by the total number of wireless subscribers at the
beginning of that period. The churn rate for the period is equal to the average of the churn rate for each month of that period.
Other service revenue increased $95, or 4.0%, in 2015
and decreased $36, or 1.5%, in 2014.
Equipment revenue decreased $3, or 0.1%, in 2015
and increased $1,532, or 34.9%, in 2014. The increase
in 2014 was primarily related to the increase in devices
sold under our AT&T Next program and the increase
in sales of higher-priced smartphones.
Operations and support expenses decreased $2,414,
or 10.1%, in 2015 and increased $1,346, or 6.0%,
in 2014. Operations and support expenses consist
of costs incurred to provide our products and services,
including costs of operating and maintaining our networks
and personnel costs, such as compensation and benefits.
Decreased operations and support expenses in 2015
were primarily due to the following:
• Selling and commission expenses decreased
$861 primarily due to lower average commission
rates, including those paid under the AT&T Next
program, combined with fewer upgrade transactions.
• Network costs decreased $434 primarily due to
lower interconnect costs resulting from our ongoing
network transition to more efficient Ethernet/IP-based
technologies.
• Equipment costs decreased $406 primarily due to
the decrease in volume of equipment sales, partially
offset by an increase in the cost of smartphones.
• Customer service costs decreased $275 primarily
due to reduced salaries and benefits, lower vendor
and professional services from reduced call volumes.
Operating revenues decreased $1,703, or 4.6%, in 2015
and increased $526, or 1.5%, in 2014. Decreased revenues
in 2015 reflect declines in postpaid service revenues due
to customers choosing Mobile Share plans and migrating
to our Business Solutions segment, partially offset by higher
prepaid service revenues. Our business wireless offerings
allow for individual subscribers to purchase wireless services
through employer-sponsored plans for a reduced price.
The migration of these subscribers to the Business Solutions
segment negatively impacted our consumer postpaid
subscriber total and service revenue growth.
Increased revenues in 2014 are primarily due to an increase
in prepaid services attributable to our acquisition of Leap
and increased equipment revenues. These increases were
partially offset by customers choosing Mobile Share plans
and migrating to our Business Solutions segment.
Postpaid wireless revenues decreased $2,252, or 9.3%,
in 2015 and $2,858, or 10.5%, in 2014. These decreases
were largely due to customers continuing to shift to
no-device-subsidy plans, which allow for discounted
monthly service charges under our Mobile Share plans
and the migration of subscribers to Business Solutions.
Without the migration of customers to Business Solutions,
postpaid wireless revenues would have decreased
approximately 4.0% in 2015 and 5.4% for 2014.
Prepaid wireless revenues increased $457, or 10.9%,
in 2015 and $1,888, or 81.5%, in 2014. Our prepaid
services, which include services sold under the Cricket
brand, are monthly prepaid services. Prepaid wireless
revenues increased in 2015 primarily due to growth
in the subscriber base. The increase in 2014 was
primarily due to our March 2014 acquisition of Leap.