AT&T Wireless 2015 Annual Report Download - page 55
Download and view the complete annual report
Please find page 55 of the 2015 AT&T Wireless annual report below. You can navigate through the pages in the report by either clicking on the pages listed below, or by using the keyword search tool below to find specific information within the annual report.-
 1
1 -
2
-
3
-
4
-
5
-
6
-
7
-
8
-
9
-
10
-
11
-
12
-
13
-
14
-
15
-
16
-
17
-
18
-
19
-
20
-
21
-
22
-
23
-
24
-
25
-
26
-
27
-
28
-
29
-
30
-
31
-
32
-
33
-
34
-
35
-
36
-
37
-
38
-
39
-
40
-
41
-
42
-
43
-
44
-
 45
45 -
 46
46 -
 47
47 -
 48
48 -
 49
49 -
 50
50 -
 51
51 -
 52
52 -
 53
53 -
 54
54 -
 55
55 -
 56
56 -
 57
57 -
 58
58 -
 59
59 -
 60
60 -
 61
61 -
 62
62 -
 63
63 -
 64
64 -
 65
65 -
66
-
67
-
68
-
69
-
70
-
71
-
72
-
73
-
74
-
75
-
76
-
77
-
78
-
79
-
80
-
81
-
82
-
83
-
84
-
85
-
86
-
87
-
88
 |
 |

AT&T INC.
|
53
wide decisions for which the individual operating segments
are not being evaluated, including interest costs and
expected return on plan assets for our pension and
postretirement benefit plans.
Certain operating items are not allocated to our business
segments:
• Acquisition-related items include (1) operations
and support items associated with the merger and
integration of newly acquired businesses, and (2) the
noncash amortization of intangible assets acquired
in acquisitions.
• Certain significant items include (1) noncash actuarial
gains and losses from pension and other
postretirement benefits, (2) employee separation
charges associated with voluntary and/or strategic
offers, (3) losses resulting from abandonment or
impairment of assets and (4) other items for which the
segments are not being evaluated.
Interest expense and other income (expense) – net,
are managed only on a total company basis and are,
accordingly, reflected only in consolidated results. Therefore,
these items are also not included in each segment’s
reportable results.
Our operating assets are utilized by multiple segments and
consist of our wireless and wired networks as well as an
international satellite fleet. We manage our assets to provide
for the most efficient, effective and integrated service to
our customers, not by operating segment, and therefore
asset information and capital expenditures by segment are
not presented. Depreciation is allocated based on network
usage or asset utilization by segment.
Ethernet-related products and broadband, collectively
referred to as strategic business services, as well as
traditional data and voice products. We utilize our wireless
and wired network and are marketed to provide a complete
communications solution to our business customers.
The Entertainment Group segment provides video, Internet
and voice communication services to residential customers
located in the U.S. or in U.S. territories. We utilize our copper
and IP-based (referred to as “wired” or “wireline”) wired
network and/or our satellite technology.
The Consumer Mobility segment provides nationwide
wireless service to consumers, and wireless wholesale and
resale subscribers located in the U.S. or in U.S. territories.
We utilize our U.S. wireless network to provide voice and
data services, including high-speed Internet, video
entertainment and home monitoring services.
The International segment provides entertainment
services in Latin America and wireless services in Mexico.
Video entertainment services are provided to primarily
residential customers using satellite technology. We utilize
our regional and national networks in Mexico to provide
consumer and business customers with wireless data
and voice communication services. Our international
subsidiaries conduct business in their local currency and
operating results are converted to U.S. dollars using
official exchange rates.
In reconciling items to consolidated operating income and
income before income taxes, Corporate and Other includes:
(1) operations that are not considered reportable segments
and that are no longer integral to our operations or which
we no longer actively market, and (2) impacts of corporate-
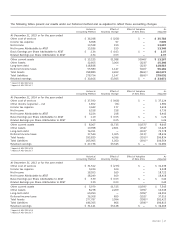
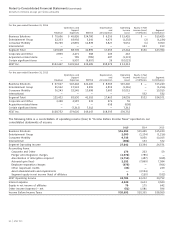
For the year ended December 31, 2015
Operations and Depreciation Operating Equity in Net
Support and Income Income (Loss) Segment
Revenue Expenses EBITDA Amortization (Loss) of Affiliates Contribution
Business Solutions $ 71,127 $ 44,946 $26,181 $ 9,789 $16,392 $— $16,392
Entertainment Group 35,294 28,345 6,949 4,945 2,004 (4) 2,000
Consumer Mobility 35,066 21,477 13,589 3,851 9,738 — 9,738
International 4,102 3,930 172 655 (483) (5) (488)
Segment Total 145,589 98,698 46,891 19,240 27,651 $(9) $27,642
Corporate and Other 1,297 1,057 240 64 176
Acquisition-related items (85) 1,987 (2,072) 2,712 (4,784)
Certain significant items — (1,742) 1,742 — 1,742
AT&T Inc. $146,801 $100,000 $46,801 $22,016 $24,785