Singapore Airlines 2007 Annual Report Download - page 98
Download and view the complete annual report
Please find page 98 of the 2007 Singapore Airlines annual report below. You can navigate through the pages in the report by either clicking on the pages listed below, or by using the keyword search tool below to find specific information within the annual report.-
 1
1 -
2
-
3
-
4
-
5
-
6
-
7
-
8
-
9
-
10
-
11
-
12
-
13
-
14
-
15
-
16
-
17
-
18
-
19
-
20
-
21
-
22
-
23
-
24
-
25
-
26
-
27
-
28
-
29
-
30
-
31
-
32
-
33
-
34
-
35
-
36
-
37
-
38
-
39
-
40
-
41
-
42
-
43
-
44
-
45
-
46
-
47
-
48
-
49
-
50
-
51
-
52
-
53
-
54
-
55
-
56
-
57
-
58
-
59
-
60
-
61
-
62
-
63
-
64
-
65
-
66
-
67
-
68
-
69
-
70
-
71
-
72
-
73
-
74
-
75
-
76
-
77
-
78
-
79
-
80
-
81
-
82
-
83
-
84
-
85
-
86
-
87
-
 88
88 -
 89
89 -
 90
90 -
 91
91 -
 92
92 -
 93
93 -
 94
94 -
 95
95 -
 96
96 -
 97
97 -
 98
98 -
 99
99 -
 100
100 -
 101
101 -
 102
102 -
 103
103 -
 104
104 -
 105
105 -
 106
106 -
 107
107 -
 108
108 -
109
-
110
-
111
-
112
-
113
-
114
-
115
-
116
-
117
-
118
-
119
-
120
-
121
-
122
-
123
-
124
-
125
-
126
-
127
-
128
-
129
-
130
-
131
-
132
-
133
-
134
-
135
-
136
-
137
-
138
-
139
-
140
-
141
-
142
-
143
-
144
-
145
-
146
-
147
-
148
-
149
-
150
-
151
-
152
-
153
-
154
-
155
-
156
-
157
-
158
-
159
-
160
 |
 |

NOTES TO THE FINANCIAL STATEMENTS
31 March 2007
Singapore Airlines 96 Annual Report 2006-07
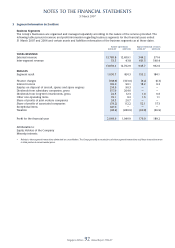
3 Segment Information (in $ million) (continued)
Geographical Segments
The following table presents revenue information on airline operations by geographical areas for the fi nancial years
ended 31 March 2007 and 2006.
By area of original sale
2006-07 2005-06
–––––––––––––––––––––––––––––––––––––––––––––––––––––––––––––––––––––––––––––––––––––––––––––––––––––––––––––––––––––––––––––––––––––––––––––––––––––––––––––––––––––
East Asia 5,974.6 5,554.5
Europe 1,957.4 1,882.4
South West Pacifi c 1,538.5 1,535.4
Americas 1,017.2 991.0
West Asia and Africa 874.7 896.2
––––––––––––––––––––––––––––––––––––
System-wide 11,362.4 10,859.5
Non-scheduled services and incidental revenue 2,476.9 1,843.4
––––––––––––––––––––––––––––––––––––
13,839.3 12,702.9
––––––––––––––––––––––––––––––––––––
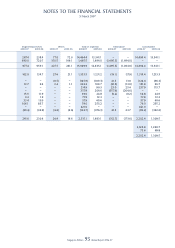
4 Staff Costs (in $ million)
The Group
2006-07 2005-06
–––––––––––––––––––––––––––––––––––––––––––––––––––––––––––––––––––––––––––––––––––––––––––––––––––––––––––––––––––––––––––––––––––––––––––––––––––––––––––––––––––––
Staff costs (including Executive Director)
Salary, bonuses and other costs 2,535.2 2,290.9
CPF and other defi ned contributions 134.6 142.1
Share-based compensation expense 57.6 48.1
––––––––––––––––––––––––––––––––––––
2,727.4 2,481.1
––––––––––––––––––––––––––––––––––––
The Group contributes to several post-employment defi ned benefi t plans for employees at several overseas locations.
Employees may contribute in some of these plans and these contributions are matched in varying amounts by the
Group. Defi ned benefi t expenses for the Group were $16.6 million for 2006-07 and $21.2 million for 2005-06. As these
are not material to the total staff costs of the Group for 2006-07 and 2005-06, additional disclosures of these defi ned
benefi t plans are not shown. Disclosures relating to share-based compensation expense are in Note 13.
5 Operating Profi t (in $ million)
Operating profi t for the fi nancial year was arrived at after charging/(crediting):
The Group
2006-07 2005-06
–––––––––––––––––––––––––––––––––––––––––––––––––––––––––––––––––––––––––––––––––––––––––––––––––––––––––––––––––––––––––––––––––––––––––––––––––––––––––––––––––––––
Interest income from short-term investments (0.8) (0.7)
Dividend income from short-term investments (0.8) (0.8)
Surplus on disposal of short-term investments (3.5) (3.7)
Income from lease of aircraft (31.4) (31.6)
Amortisation of deferred gain on sale and operating leaseback transactions (88.4) (103.5)
Professional fees paid to a fi rm of which a director is a member * *
Remuneration for auditors of the Company
Audit fees 1.6 1.5
Non-audit fees 1.0 0.8
Exchange losses, net 79.9 163.2
––––––––––––––––––––––––––––––––––––
* Amount less than $0.1 million.