Singapore Airlines 2007 Annual Report Download - page 141
Download and view the complete annual report
Please find page 141 of the 2007 Singapore Airlines annual report below. You can navigate through the pages in the report by either clicking on the pages listed below, or by using the keyword search tool below to find specific information within the annual report.-
 1
1 -
2
-
3
-
4
-
5
-
6
-
7
-
8
-
9
-
10
-
11
-
12
-
13
-
14
-
15
-
16
-
17
-
18
-
19
-
20
-
21
-
22
-
23
-
24
-
25
-
26
-
27
-
28
-
29
-
30
-
31
-
32
-
33
-
34
-
35
-
36
-
37
-
38
-
39
-
40
-
41
-
42
-
43
-
44
-
45
-
46
-
47
-
48
-
49
-
50
-
51
-
52
-
53
-
54
-
55
-
56
-
57
-
58
-
59
-
60
-
61
-
62
-
63
-
64
-
65
-
66
-
67
-
68
-
69
-
70
-
71
-
72
-
73
-
74
-
75
-
76
-
77
-
78
-
79
-
80
-
81
-
82
-
83
-
84
-
85
-
86
-
87
-
88
-
89
-
90
-
91
-
92
-
93
-
94
-
95
-
96
-
97
-
98
-
99
-
100
-
101
-
102
-
103
-
104
-
105
-
106
-
107
-
108
-
109
-
110
-
111
-
112
-
113
-
114
-
115
-
116
-
117
-
118
-
119
-
120
-
121
-
122
-
123
-
124
-
125
-
126
-
127
-
128
-
129
-
130
-
 131
131 -
 132
132 -
 133
133 -
 134
134 -
 135
135 -
 136
136 -
 137
137 -
 138
138 -
 139
139 -
 140
140 -
 141
141 -
 142
142 -
 143
143 -
 144
144 -
 145
145 -
 146
146 -
 147
147 -
 148
148 -
 149
149 -
 150
150 -
 151
151 -
152
-
153
-
154
-
155
-
156
-
157
-
158
-
159
-
160
 |
 |

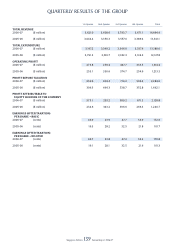
Singapore Airlines 139 Annual Report 2006-07
1st Quarter 2nd Quarter 3rd Quarter 4th Quarter Total
––––––––––––––––––––––––––––––––––––––––––––––––––––––––––––––––––––––––––––––––––––––––––––––––––––––––––––––––––––––––––––––––––––––––––––––––––––––––––––––––
TOTAL REVENUE
2006-07 ($ million) 3,421.0 3,608.6 3,793.7 3,671.1 14,494.4
2005-06 ($ million) 3,044.4 3,350.3 3,557.0 3,389.4 13,341.1
TOTAL EXPENDITURE
2006-07 ($ million) 3,147.2 3,349.2 3,346.0 3,337.6 13,180.0
2005-06 ($ million) 2,791.3 3,019.7 3,182.3 3,134.5 12,127.8
OPERATING PROFIT
2006-07 ($ million) 273.8 259.4 447.7 333.5 1,314.4
2005-06 ($ million) 253.1 330.6 374.7 254.9 1,213.3
PROFIT BEFORE TAXATION
2006-07 ($ million) 659.6 404.4 714.2 506.4 2,284.6
2005-06 ($ million) 306.3 464.3 538.7 352.8 1,662.1
PROFIT ATTRIBUTABLE TO
EQUITY HOLDERS OF THE COMPANY
2006-07 ($ million) 575.1 293.2 589.2 671.3 2,128.8
2005-06 ($ million) 234.6 343.2 396.6 266.3 1,240.7
EARNINGS (AFTER TAXATION)
PER SHARE – BASIC
2006-07 (cents) 46.9 23.9 47.7 53.9 172.6
2005-06 (cents) 19.3 28.2 32.5 21.8 101.7
EARNINGS (AFTER TAXATION)
PER SHARE – DILUTED
2006-07 (cents) 46.7 23.8 47.2 53.2 170.8
2005-06 (cents) 19.1 28.1 32.5 21.6 101.3
QUARTERLY RESULTS OF THE GROUP