Singapore Airlines 2007 Annual Report Download - page 51
Download and view the complete annual report
Please find page 51 of the 2007 Singapore Airlines annual report below. You can navigate through the pages in the report by either clicking on the pages listed below, or by using the keyword search tool below to find specific information within the annual report.-
 1
1 -
2
-
3
-
4
-
5
-
6
-
7
-
8
-
9
-
10
-
11
-
12
-
13
-
14
-
15
-
16
-
17
-
18
-
19
-
20
-
21
-
22
-
23
-
24
-
25
-
26
-
27
-
28
-
29
-
30
-
31
-
32
-
33
-
34
-
35
-
36
-
37
-
38
-
39
-
40
-
 41
41 -
 42
42 -
 43
43 -
 44
44 -
 45
45 -
 46
46 -
 47
47 -
 48
48 -
 49
49 -
 50
50 -
 51
51 -
 52
52 -
 53
53 -
 54
54 -
 55
55 -
 56
56 -
 57
57 -
 58
58 -
 59
59 -
 60
60 -
 61
61 -
62
-
63
-
64
-
65
-
66
-
67
-
68
-
69
-
70
-
71
-
72
-
73
-
74
-
75
-
76
-
77
-
78
-
79
-
80
-
81
-
82
-
83
-
84
-
85
-
86
-
87
-
88
-
89
-
90
-
91
-
92
-
93
-
94
-
95
-
96
-
97
-
98
-
99
-
100
-
101
-
102
-
103
-
104
-
105
-
106
-
107
-
108
-
109
-
110
-
111
-
112
-
113
-
114
-
115
-
116
-
117
-
118
-
119
-
120
-
121
-
122
-
123
-
124
-
125
-
126
-
127
-
128
-
129
-
130
-
131
-
132
-
133
-
134
-
135
-
136
-
137
-
138
-
139
-
140
-
141
-
142
-
143
-
144
-
145
-
146
-
147
-
148
-
149
-
150
-
151
-
152
-
153
-
154
-
155
-
156
-
157
-
158
-
159
-
160
 |
 |

Singapore Airlines 49 Annual Report 2006-07
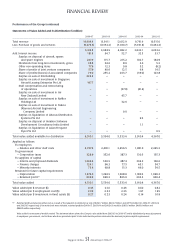
Performance of the Group (continued)
Financial Position of the Group (continued)
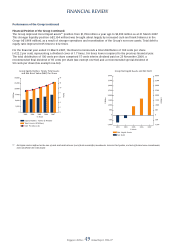
The Group improved its net liquid assets R1 position from $1,706 million a year ago to $3,810 million as at 31 March 2007.
This stronger liquidity position (+$2,104 million) was brought about largely by increased cash and bank balances in the
Group (+$1,966 million), as a result of stronger operations and monetisation of the Group’s non-core assets. Total debt to
equity ratio improved 0.05 times to 0.12 times.
For the fi nancial year ended 31 March 2007, the Board recommends a total distribution of 100 cents per share
(+122.2 per cent), representing a dividend cover of 1.7 times, 0.6 times lower compared to the previous fi nancial year.
The total distribution of 100 cents per share comprised 15 cents interim dividend paid on 23 November 2006, a
recommended fi nal dividend of 35 cents per share (tax exempt one-tier) and a recommended special dividend of
50 cents per share (tax exempt one-tier).
R1 Net liquid assets is defi ned as the sum of cash and bank balances (net of bank overdrafts), investments, loans to third parties, and net of fi nance lease commitments,
loans and fi xed rate notes issued.
FINANCIAL REVIEW