Singapore Airlines 2007 Annual Report Download - page 63
Download and view the complete annual report
Please find page 63 of the 2007 Singapore Airlines annual report below. You can navigate through the pages in the report by either clicking on the pages listed below, or by using the keyword search tool below to find specific information within the annual report.-
 1
1 -
2
-
3
-
4
-
5
-
6
-
7
-
8
-
9
-
10
-
11
-
12
-
13
-
14
-
15
-
16
-
17
-
18
-
19
-
20
-
21
-
22
-
23
-
24
-
25
-
26
-
27
-
28
-
29
-
30
-
31
-
32
-
33
-
34
-
35
-
36
-
37
-
38
-
39
-
40
-
41
-
42
-
43
-
44
-
45
-
46
-
47
-
48
-
49
-
50
-
51
-
52
-
 53
53 -
 54
54 -
 55
55 -
 56
56 -
 57
57 -
 58
58 -
 59
59 -
 60
60 -
 61
61 -
 62
62 -
 63
63 -
 64
64 -
 65
65 -
 66
66 -
 67
67 -
 68
68 -
 69
69 -
 70
70 -
 71
71 -
 72
72 -
 73
73 -
74
-
75
-
76
-
77
-
78
-
79
-
80
-
81
-
82
-
83
-
84
-
85
-
86
-
87
-
88
-
89
-
90
-
91
-
92
-
93
-
94
-
95
-
96
-
97
-
98
-
99
-
100
-
101
-
102
-
103
-
104
-
105
-
106
-
107
-
108
-
109
-
110
-
111
-
112
-
113
-
114
-
115
-
116
-
117
-
118
-
119
-
120
-
121
-
122
-
123
-
124
-
125
-
126
-
127
-
128
-
129
-
130
-
131
-
132
-
133
-
134
-
135
-
136
-
137
-
138
-
139
-
140
-
141
-
142
-
143
-
144
-
145
-
146
-
147
-
148
-
149
-
150
-
151
-
152
-
153
-
154
-
155
-
156
-
157
-
158
-
159
-
160
 |
 |

Singapore Airlines 61 Annual Report 2006-07
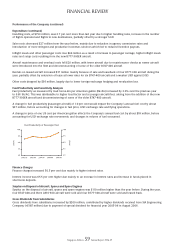
Performance of the Company (continued)
Restricted Share Plan and Performance Share Plan
At the extraordinary general meeting of the Company held on 28 July 2005, the Company’s shareholders approved the
adoption of two new share plans, namely the Restricted Share Plan (“RSP”) and Performance Share Plan (“PSP”), in addition
to the Employee Share Option Plan.
As at 31 March 2007, the number of outstanding shares granted under the Company’s RSP and PSP were 258,330 and
140,900 respectively.
Depending on the achievement of pre-determined targets over a two-year period for the RSP and a three-year period for the
PSP, the fi nal number of restricted shares and performance shares awarded could range between 0% to 120% of the initial
grant of the restricted shares and between 0% to 150% of the initial grant of the performance shares.
Performance of Subsidiary Companies
There were 25 subsidiary companies in the SIA Group as at 31 March 2007. The major subsidiary companies are Singapore
Airport Terminal Services Limited (“SATS”), SIA Engineering Company Limited (“SIAEC”), Singapore Airlines Cargo Pte Ltd (“SIA
Cargo”) and SilkAir (Singapore) Private Limited (“SilkAir”). The following performance review includes intra-group transactions.
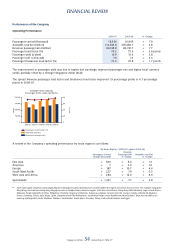
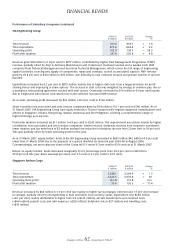
Singapore Airport Terminal Services Group
2006-07 2005-06 Change
$ million $ million %
–––––––––––––––––––––––––––––––––––––––––––––––––––––––––––––––––––––––––––––––––––––––––––––––––––––––––––––––––––––––––––––––––––––––––––––––––––––––––––––––––––––––––––––––––––
Total revenue 945.7 932.0 + 1.5
Total expenditure 792.5 747.9 + 6.0
Operating profi t 153.2 184.1 – 16.8
Profi t after taxation 179.0 189.2 – 5.4
–––––––––––––––––––––––––––––––––––––––––––––––––––––––––––––––––––––––––––––––––––––––––––––––––––––––––––––––––––––––––––––––––––––––––––––––––––––––––––––––––––––––––––––––––––
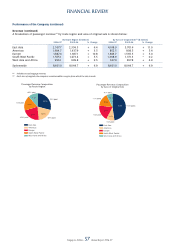
SATS Group’s operating revenue was $946 million, an increase of 1.5 per cent over the last fi nancial year due primarily
to higher business volume. Revenue from ground handling, which constituted 46.1 per cent of the total SATS Group’s
revenue, increased 0.8 per cent from $433 million to $437 million because of higher business volume. Revenue from infl ight
catering, which constituted 43.3 per cent of the total SATS Group’s revenue, increased 3.4 per cent from $396 million to
$410 million due to higher number of meals uplifted. This however was partially offset by rates pressures under the
competitive environment and suspension of fl ights into Singapore by some of the Group’s existing customers. Revenue
from aviation security services dropped 16.2 per cent because of the cessation of hold-baggage screening contract with
Civil Aviation Authority of Singapore from end August 2006.
Operating expenditure increased $45 million (+6.0 per cent) to $793 million mainly from higher staff costs. Staff costs
increased $33 million (+8.1 per cent) on higher provision for profi t-sharing bonus.
As a consequence, SATS Group’s operating profi t decreased $31 million (-16.8 per cent) to $153 million.
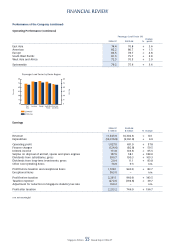
Profi t contribution from overseas associated companies decreased 9.1 per cent to $52 million for the fi nancial year ended
31 March 2007, mainly from the reduction in profi t from Asia Airfreight Terminal due to additional operating costs and
depreciation for the new Hong Kong terminal which was operational from December 2006.
Profi t after taxation decreased $10 million (-5.4 per cent) to $179 million, due to lower operating profi t and contribution from
associated companies, partially offset by lower taxation and tax write-back of $7 million arising from reduction in statutory
tax rate from 20 per cent to 18 per cent.
As at 31 March 2007, equity holders’ funds of the SATS Group was $1,314 million (+9.3 per cent). The increase was mainly
attributable to the profi t for the fi nancial year of $179 million and $33 million share options exercised. This increase was
partially offset by dividend payments of $50 million and $34 million respectively in August 2006 and November 2006. Net
asset value per share of the Group increased $0.09 (+7.8 per cent) to $1.24 as at 31 March 2007.
Return on equity holders’ funds at 14.2 per cent was 2.5 percentage points lower than the last fi nancial year. Basic earnings
per share decreased 1.2 cents (-6.6 per cent) to 17.0 cents.
FINANCIAL REVIEW