Singapore Airlines 2007 Annual Report Download - page 136
Download and view the complete annual report
Please find page 136 of the 2007 Singapore Airlines annual report below. You can navigate through the pages in the report by either clicking on the pages listed below, or by using the keyword search tool below to find specific information within the annual report.-
 1
1 -
2
-
3
-
4
-
5
-
6
-
7
-
8
-
9
-
10
-
11
-
12
-
13
-
14
-
15
-
16
-
17
-
18
-
19
-
20
-
21
-
22
-
23
-
24
-
25
-
26
-
27
-
28
-
29
-
30
-
31
-
32
-
33
-
34
-
35
-
36
-
37
-
38
-
39
-
40
-
41
-
42
-
43
-
44
-
45
-
46
-
47
-
48
-
49
-
50
-
51
-
52
-
53
-
54
-
55
-
56
-
57
-
58
-
59
-
60
-
61
-
62
-
63
-
64
-
65
-
66
-
67
-
68
-
69
-
70
-
71
-
72
-
73
-
74
-
75
-
76
-
77
-
78
-
79
-
80
-
81
-
82
-
83
-
84
-
85
-
86
-
87
-
88
-
89
-
90
-
91
-
92
-
93
-
94
-
95
-
96
-
97
-
98
-
99
-
100
-
101
-
102
-
103
-
104
-
105
-
106
-
107
-
108
-
109
-
110
-
111
-
112
-
113
-
114
-
115
-
116
-
117
-
118
-
119
-
120
-
121
-
122
-
123
-
124
-
125
-
 126
126 -
 127
127 -
 128
128 -
 129
129 -
 130
130 -
 131
131 -
 132
132 -
 133
133 -
 134
134 -
 135
135 -
 136
136 -
 137
137 -
 138
138 -
 139
139 -
 140
140 -
 141
141 -
 142
142 -
 143
143 -
 144
144 -
 145
145 -
 146
146 -
147
-
148
-
149
-
150
-
151
-
152
-
153
-
154
-
155
-
156
-
157
-
158
-
159
-
160
 |
 |

NOTES TO THE FINANCIAL STATEMENTS
31 March 2007
Singapore Airlines 134 Annual Report 2006-07
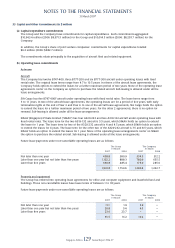
36 Financial Instruments (in $ million) (continued)
(b) Interest rate risk
The following tables set out the carrying amount, by earlier of contractual repricing or maturity dates, of the Group’s
and Company’s fi nancial instruments that are exposed to interest rate risk:
Within 1 1-2 2-3 3-4 4-5 More than
year years years years years 5 years Total
–––––––––––––––––––––––––––––––––––––––––––––––––––––––––––––––––––––––––––––––––––––––––––––––––––––––––––––––––––––––––––––––––––––––––––––––––––––––
2007
Group
Fixed rate
Notes payable – – 200.0 – 900.0 – 1,100.0
Obligations under fi nance leases* 29.2 31.2 33.3 35.6 38.0 178.1 345.4
Loans to associated companies – – – – – 2.6 2.6
Floating rate
Obligations under fi nance leases 317.7 – – – – – 317.7
Cash and bank balances 5,117.6 – – – – – 5,117.6
Bank overdrafts 23.9 – – – – – 23.9
Loans 116.3 – – – – – 116.3
Loans to associated companies 133.0 – – – – – 133.0
Company
Fixed rate
Notes payable – – – – 900.0 – 900.0
Funds from subsidiaries 1,771.7 – – – – – 1,771.7
Floating rate
Cash and bank balances 4,627.5 – – – – – 4,627.5
Bank overdrafts 23.9 – – – – – 23.9
Loans to associated companies 133.0 – – – – – 133.0
2006
Group
Fixed rate
Bonds 382.4 – – – – – 382.4
Bank overdrafts 0.4 – – – – – 0.4
Notes payable – – – 200.0 – 900.0 1,100.0
Obligations under fi nance leases* 434.3 138.2 17.1 18.4 19.8 68.4 696.2
Loans to associated companies – – – – – 3.2 3.2
Floating rate
Obligations under fi nance leases 366.7 2.0 – – – – 368.7
Cash and bank balances 3,151.6 – – – – – 3,151.6
Bank overdrafts 10.0 – – – – – 10.0
Loans 140.7 – – – – – 140.7
Loans to associated companies 133.0 – – – – – 133.0
Company
Fixed rate
Bonds 382.4 – – – – – 382.4
Notes payable – – – – – 900.0 900.0
Funds from subsidiaries 1,220.9 – – – – – 1,220.9
Obligations under fi nance leases* 419.5 122.3 – – – – 541.8
Floating rate
Cash and bank balances 2,765.1 – – – – – 2,765.1
Bank overdrafts 9.0 – – – – – 9.0
Loans to associated companies 133.0 – – – – – 133.0
* The Group and Company have entered into interest rate swap agreements to swap some of the fl oating rate lease liabilities into fi xed rate.