Singapore Airlines 2007 Annual Report Download - page 137
Download and view the complete annual report
Please find page 137 of the 2007 Singapore Airlines annual report below. You can navigate through the pages in the report by either clicking on the pages listed below, or by using the keyword search tool below to find specific information within the annual report.-
 1
1 -
2
-
3
-
4
-
5
-
6
-
7
-
8
-
9
-
10
-
11
-
12
-
13
-
14
-
15
-
16
-
17
-
18
-
19
-
20
-
21
-
22
-
23
-
24
-
25
-
26
-
27
-
28
-
29
-
30
-
31
-
32
-
33
-
34
-
35
-
36
-
37
-
38
-
39
-
40
-
41
-
42
-
43
-
44
-
45
-
46
-
47
-
48
-
49
-
50
-
51
-
52
-
53
-
54
-
55
-
56
-
57
-
58
-
59
-
60
-
61
-
62
-
63
-
64
-
65
-
66
-
67
-
68
-
69
-
70
-
71
-
72
-
73
-
74
-
75
-
76
-
77
-
78
-
79
-
80
-
81
-
82
-
83
-
84
-
85
-
86
-
87
-
88
-
89
-
90
-
91
-
92
-
93
-
94
-
95
-
96
-
97
-
98
-
99
-
100
-
101
-
102
-
103
-
104
-
105
-
106
-
107
-
108
-
109
-
110
-
111
-
112
-
113
-
114
-
115
-
116
-
117
-
118
-
119
-
120
-
121
-
122
-
123
-
124
-
125
-
126
-
 127
127 -
 128
128 -
 129
129 -
 130
130 -
 131
131 -
 132
132 -
 133
133 -
 134
134 -
 135
135 -
 136
136 -
 137
137 -
 138
138 -
 139
139 -
 140
140 -
 141
141 -
 142
142 -
 143
143 -
 144
144 -
 145
145 -
 146
146 -
 147
147 -
148
-
149
-
150
-
151
-
152
-
153
-
154
-
155
-
156
-
157
-
158
-
159
-
160
 |
 |

NOTES TO THE FINANCIAL STATEMENTS
31 March 2007
Singapore Airlines 135 Annual Report 2006-07
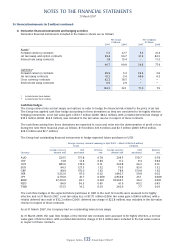
36 Financial Instruments (in $ million) (continued)
(c) Derivative fi nancial instruments and hedging activities
Derivative fi nancial instruments included in the balance sheets are as follows:
The Group The Company
31 March 31 March
2007 2006 2007 2006
–––––––––––––––––––––––––––––––––––––––––––––––––––––––––––––––––––––––––––––––––––––––––––––––––––––––––––––––––––––––––––––––––––––––––––––––––––––––
Assets *
Forward currency contracts 5.5 27.7 3.3 21.4
Jet fuel swap and option contracts 39.4 56.7 31.5 44.5
Interest rate swap contracts 1.8 15.4 – 11.5
––––––––––––––––––––––––––––––––––––––––––––––––––––––––––––––––––––––––
46.7 99.8 34.8 77.4
––––––––––––––––––––––––––––––––––––––––––––––––––––––––––––––––––––––––
Liabilities #
Forward currency contracts 29.9 5.3 22.4 3.6
Jet fuel swap contracts 61.2 5.4 48.6 4.3
Cross currency contracts 42.2 18.5 – –
Interest rate swap contracts 0.9 2.9 – –
––––––––––––––––––––––––––––––––––––––––––––––––––––––––––––––––––––––––
134.2 32.1 71.0 7.9
––––––––––––––––––––––––––––––––––––––––––––––––––––––––––––––––––––––––
* Included under trade debtors
# Included under trade creditors
Cash fl ow hedges
The Group entered into jet fuel swaps and options in order to hedge the fi nancial risk related to the price of jet fuel.
The Group has applied cash fl ow hedge accounting to these derivatives as they are considered to be highly effective
hedging instruments. A net fair value gain of $33.7 million (2006: $82.2 million), with a related deferred tax charge of
$18.3 million (2006: $34.5 million), was included in the fair value reserve in respect of these contracts.
The cash fl ows arising from these derivatives are expected to occur and enter into the determination of profi t or loss
during the next three fi nancial years as follows: $17.4 million, $13.6 million and $2.7 million (2006: $55.0 million,
$24.5 million and $2.7 million).
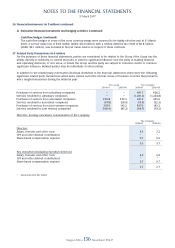
The Group had outstanding fi nancial instruments to hedge expected future purchases in USD:
Foreign currency contracts maturing in April 2007 – March 2008 (in $ million)
Group Company
–––––––––––––––––––––––––––––––––––––––––––––––––––––––– –––––––––––––––––––––––––––––––––––––––––––––––––––––––––––
Foreign currency USD Effective Foreign currency USD Effective
Currency amount sold purchased rate amount sold purchased rate
–––––––––––––––––––––––––––––––––––––––––––––––––––––––––––––––––––––––––––––––––––––––––––––––––––––––––––––––––––––––––––––––––––––––––––––––––––––––
AUD 226.5 175.8 0.78 204.5 158.7 0.78
CHF 14.8 12.4 0.84 11.2 9.4 0.84
CNY 885.0 118.0 0.13 346.8 46.2 0.13
EUR 96.3 127.3 1.32 70.3 93.0 1.32
GBP 88.4 170.0 1.92 78.4 150.8 1.92
INR 3,102.0 67.0 0.02 1,842.7 39.8 0.02
JPY 4,710.0 41.7 0.009 2,836.8 25.1 0.009
KRW 27,210.0 29.1 0.001 18,905.7 20.2 0.001
NZD 86.9 56.3 0.65 61.9 40.2 0.65
TWD 513.3 16.2 0.03 242.6 7.7 0.03
The cash fl ow hedges of the expected future purchases in USD in the next 12 months were assessed to be highly
effective and at 31 March 2007, a net fair value loss of $117.1 million (2006: fair value gain of $60.6 million), with a
related deferred tax credit of $32.2 million (2006: deferred tax charge of $22.8 million), was included in the fair value
reserve in respect of these contracts.
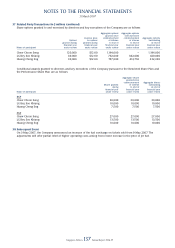
As at 31 March 2007, the Company had no outstanding interest rate swaps.
At 31 March 2006, the cash fl ow hedges of the interest rate contracts were assessed to be highly effective, a net fair
value gain of $12.0 million, with a related deferred tax charge of $2.3 million were included in the fair value reserve
in respect of these contracts.