Singapore Airlines 2007 Annual Report Download - page 108
Download and view the complete annual report
Please find page 108 of the 2007 Singapore Airlines annual report below. You can navigate through the pages in the report by either clicking on the pages listed below, or by using the keyword search tool below to find specific information within the annual report.-
 1
1 -
2
-
3
-
4
-
5
-
6
-
7
-
8
-
9
-
10
-
11
-
12
-
13
-
14
-
15
-
16
-
17
-
18
-
19
-
20
-
21
-
22
-
23
-
24
-
25
-
26
-
27
-
28
-
29
-
30
-
31
-
32
-
33
-
34
-
35
-
36
-
37
-
38
-
39
-
40
-
41
-
42
-
43
-
44
-
45
-
46
-
47
-
48
-
49
-
50
-
51
-
52
-
53
-
54
-
55
-
56
-
57
-
58
-
59
-
60
-
61
-
62
-
63
-
64
-
65
-
66
-
67
-
68
-
69
-
70
-
71
-
72
-
73
-
74
-
75
-
76
-
77
-
78
-
79
-
80
-
81
-
82
-
83
-
84
-
85
-
86
-
87
-
88
-
89
-
90
-
91
-
92
-
93
-
94
-
95
-
96
-
97
-
 98
98 -
 99
99 -
 100
100 -
 101
101 -
 102
102 -
 103
103 -
 104
104 -
 105
105 -
 106
106 -
 107
107 -
 108
108 -
 109
109 -
 110
110 -
 111
111 -
 112
112 -
 113
113 -
 114
114 -
 115
115 -
 116
116 -
 117
117 -
 118
118 -
119
-
120
-
121
-
122
-
123
-
124
-
125
-
126
-
127
-
128
-
129
-
130
-
131
-
132
-
133
-
134
-
135
-
136
-
137
-
138
-
139
-
140
-
141
-
142
-
143
-
144
-
145
-
146
-
147
-
148
-
149
-
150
-
151
-
152
-
153
-
154
-
155
-
156
-
157
-
158
-
159
-
160
 |
 |

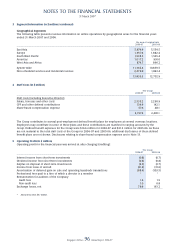
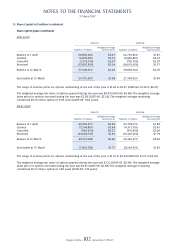
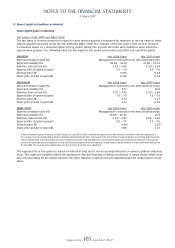
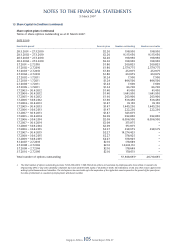
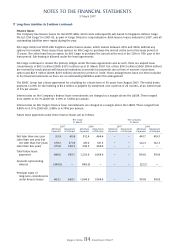
NOTES TO THE FINANCIAL STATEMENTS
31 March 2007
Singapore Airlines 106 Annual Report 2006-07
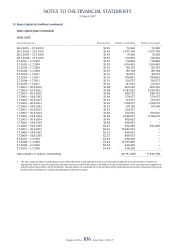
13 Share Capital (in $ million) (continued)
Share option plans (continued)
SIAEC ESOP
Exercisable period Exercise price Number outstanding Number exercisable
–––––––––––––––––––––––––––––––––––––––––––––––––––––––––––––––––––––––––––––––––––––––––––––––––––––––––––––––––––––––––––––––––––––––––––––––––––––––––––––––––––––
28.3.2001 – 27.3.2010 $1.65 72,600 72,600
28.3.2002 – 27.3.2010 $1.65 1,977,700 1,977,700
28.3.2003 – 27.3.2010 $1.65 76,100 76,100
28.3.2004 – 27.3.2010 $1.65 124,600 124,600
3.7.2001 – 2.7.2010 $1.55 116,899 116,899
3.7.2002 – 2.7.2010 $1.55 1,516,401 1,516,401
3.7.2003 – 2.7.2010 $1.55 187,155 187,155
3.7.2004 – 2.7.2010 $1.55 187,158 187,158
2.7.2002 – 1.7.2011 $1.01 84,975 84,975
2.7.2003 – 1.7.2011 $1.01 766,825 766,825
2.7.2004 – 1.7.2011 $1.01 120,575 120,575
2.7.2005 – 1.7.2011 $1.01 131,525 131,525
1.7.2003 – 30.6.2012 $1.98 460,500 460,500
1.7.2004 – 30.6.2012 $1.98 4,281,425 4,281,425
1.7.2005 – 30.6.2012 $1.98 549,725 549,725
1.7.2006 – 30.6.2012 $1.98 579,475 579,475
1.7.2004 – 30.6.2013 $1.35 133,375 133,375
1.7.2005 – 30.6.2013 $1.35 1,158,375 1,158,375
1.7.2006 – 30.6.2013 $1.35 176,100 176,100
1.7.2007 – 30.6.2013 $1.35 320,375 –
1.7.2005 – 30.6.2014 $1.69 374,625 374,625
1.7.2006 – 30.6.2014 $1.69 4,198,675 4,198,675
1.7.2007 – 30.6.2014 $1.69 609,625 –
1.7.2008 – 30.6.2014 $1.69 609,625 –
1.7.2006 – 30.6.2015 $2.25 562,000 562,000
1.7.2007 – 30.6.2015 $2.25 13,943,225 –
1.7.2008 – 30.6.2015 $2.25 669,625 –
1.7.2009 – 30.6.2015 $2.25 669,625 –
3.7.2007 – 2.7.2016 $3.44 436,200 –
3.7.2008 – 2.7.2016 $3.44 13,763,800 –
3.7.2009 – 2.7.2016 $3.44 436,200 –
3.7.2010 – 2.7.2016 $3.44 436,200 –
––––––––––––––––––––––––––––––––––––––––––––––––
Total number of options outstanding 49,731,288
@ 17,836,788
––––––––––––––––––––––––––––––––––––––––––––––––
@ The total number of options outstanding includes 3,893,225 (2006: 4,018,475) share options not exercised by employees who have retired or ceased to be
employed by SIAEC or any of its subsidiary companies by reason of (i) ill health, injury or disability or death; (ii) redundancy; or (iii) any other reason approved in
writing by the Compensation and HR Committee. The said options are exercisable up to the expiration of the applicable exercise period or the period of fi ve years
from the date of retirement or cessation of employment, whichever is earlier.