Singapore Airlines 2007 Annual Report Download - page 105
Download and view the complete annual report
Please find page 105 of the 2007 Singapore Airlines annual report below. You can navigate through the pages in the report by either clicking on the pages listed below, or by using the keyword search tool below to find specific information within the annual report.-
 1
1 -
2
-
3
-
4
-
5
-
6
-
7
-
8
-
9
-
10
-
11
-
12
-
13
-
14
-
15
-
16
-
17
-
18
-
19
-
20
-
21
-
22
-
23
-
24
-
25
-
26
-
27
-
28
-
29
-
30
-
31
-
32
-
33
-
34
-
35
-
36
-
37
-
38
-
39
-
40
-
41
-
42
-
43
-
44
-
45
-
46
-
47
-
48
-
49
-
50
-
51
-
52
-
53
-
54
-
55
-
56
-
57
-
58
-
59
-
60
-
61
-
62
-
63
-
64
-
65
-
66
-
67
-
68
-
69
-
70
-
71
-
72
-
73
-
74
-
75
-
76
-
77
-
78
-
79
-
80
-
81
-
82
-
83
-
84
-
85
-
86
-
87
-
88
-
89
-
90
-
91
-
92
-
93
-
94
-
 95
95 -
 96
96 -
 97
97 -
 98
98 -
 99
99 -
 100
100 -
 101
101 -
 102
102 -
 103
103 -
 104
104 -
 105
105 -
 106
106 -
 107
107 -
 108
108 -
 109
109 -
 110
110 -
 111
111 -
 112
112 -
 113
113 -
 114
114 -
 115
115 -
116
-
117
-
118
-
119
-
120
-
121
-
122
-
123
-
124
-
125
-
126
-
127
-
128
-
129
-
130
-
131
-
132
-
133
-
134
-
135
-
136
-
137
-
138
-
139
-
140
-
141
-
142
-
143
-
144
-
145
-
146
-
147
-
148
-
149
-
150
-
151
-
152
-
153
-
154
-
155
-
156
-
157
-
158
-
159
-
160
 |
 |

NOTES TO THE FINANCIAL STATEMENTS
31 March 2007
Singapore Airlines 103 Annual Report 2006-07
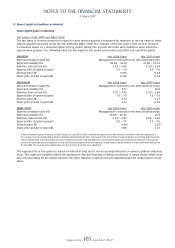
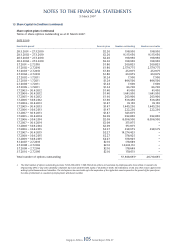
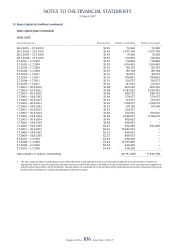
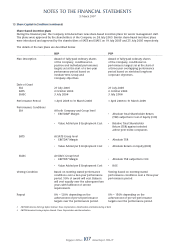
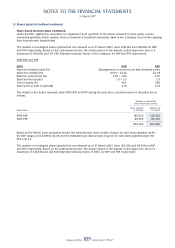
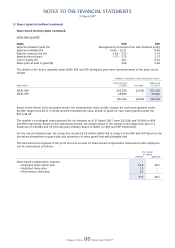
13 Share Capital (in $ million) (continued)
Share option plans (continued)
Fair values of SIA, SATS and SIAEC ESOP
The fair value of services received in return for share options granted is measured by reference to the fair value of share
options granted each year under the SIA, SATS and SIAEC ESOP. The estimate of the fair value of the services received
is measured based on a binomial option pricing model, taking into account the terms and conditions upon which the
options were granted. The following table lists the inputs to the model used for the July 2006 and July 2005 grants:
SIA ESOP July 2006 Grant July 2005 Grant
Expected dividend yield (%) Management’s forecast in line with dividend policy
Expected volatility (%) 29.99 – 30.16 31.58 – 33.33
Risk-free interest rate (%) 3.37 – 3.45 2.29 – 2.44
Expected life of options (years) 5.5 – 7.0 5.5 – 7.0
Exercise price ($) 12.60 11.28
Share price at date of grant ($) 12.60 11.20
SATS ESOP July 2006 Grant July 2005 Grant
Expected dividend yield (%) Management’s forecast in line with dividend policy
Expected volatility (%) 27.7 26.0
Risk-free interest rate (%) 3.37 – 3.45 2.29 – 2.44
Expected life of options (years) 5.5 – 7.0 5.5 – 7.0
Exercise price ($) 2.10 2.27
Share price at date of grant ($) 2.13 2.30
SIAEC ESOP July 2006 Grant July 2005 Grant
Expected dividend yield (%) Management’s forecast in line with dividend policy
Expected volatility (%) 25.06 – 25.36 25.9
Risk-free interest rate (%) 3.37 – 3.45 2.29 – 2.44
Expected life of options (years) 5.5 – 7.0 5.5 – 7.0
Exercise price ($) 3.44 # 2.25 #
Share price at date of grant ($) 3.96 2.41
# At the extraordinary general meeting of SIAEC held on 26 July 2004, SIAEC’s shareholders approved an amendment to the Plan to allow for adjustment to
the exercise prices of existing options by the Committee administering the Plan, in the event of the declaration of a special dividend. Following approval by the
SIAEC’s shareholders of the declaration of a special dividend of $0.20 on 26 July 2004, the said Committee approved another $0.20 reduction in the exercise
prices of the share options outstanding on 25 July 2006 following approval by the Company’s shareholders of the declaration of a special dividend of $0.20 on
21 July 2006. The exercise prices refl ected here are the exercise prices after such adjustment.
The expected life of the options is based on historical data and is not necessarily indicative of exercise patterns that may
occur. The expected volatility refl ects the assumption that the historical volatility is indicative of future trends, which may
also not necessarily be the actual outcome. No other features of options were incorporated into the measurement of fair
value.