Singapore Airlines 2007 Annual Report Download - page 142
Download and view the complete annual report
Please find page 142 of the 2007 Singapore Airlines annual report below. You can navigate through the pages in the report by either clicking on the pages listed below, or by using the keyword search tool below to find specific information within the annual report.-
 1
1 -
2
-
3
-
4
-
5
-
6
-
7
-
8
-
9
-
10
-
11
-
12
-
13
-
14
-
15
-
16
-
17
-
18
-
19
-
20
-
21
-
22
-
23
-
24
-
25
-
26
-
27
-
28
-
29
-
30
-
31
-
32
-
33
-
34
-
35
-
36
-
37
-
38
-
39
-
40
-
41
-
42
-
43
-
44
-
45
-
46
-
47
-
48
-
49
-
50
-
51
-
52
-
53
-
54
-
55
-
56
-
57
-
58
-
59
-
60
-
61
-
62
-
63
-
64
-
65
-
66
-
67
-
68
-
69
-
70
-
71
-
72
-
73
-
74
-
75
-
76
-
77
-
78
-
79
-
80
-
81
-
82
-
83
-
84
-
85
-
86
-
87
-
88
-
89
-
90
-
91
-
92
-
93
-
94
-
95
-
96
-
97
-
98
-
99
-
100
-
101
-
102
-
103
-
104
-
105
-
106
-
107
-
108
-
109
-
110
-
111
-
112
-
113
-
114
-
115
-
116
-
117
-
118
-
119
-
120
-
121
-
122
-
123
-
124
-
125
-
126
-
127
-
128
-
129
-
130
-
131
-
 132
132 -
 133
133 -
 134
134 -
 135
135 -
 136
136 -
 137
137 -
 138
138 -
 139
139 -
 140
140 -
 141
141 -
 142
142 -
 143
143 -
 144
144 -
 145
145 -
 146
146 -
 147
147 -
 148
148 -
 149
149 -
 150
150 -
 151
151 -
 152
152 -
153
-
154
-
155
-
156
-
157
-
158
-
159
-
160
 |
 |

Singapore Airlines 140 Annual Report 2006-07
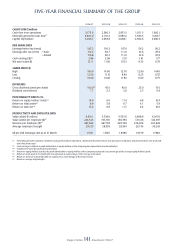
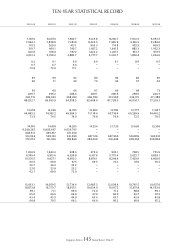
FIVE-YEAR FINANCIAL SUMMARY OF THE GROUP
2006-07 2005-06 2004-05 2003-04 2002-03
––––––––––––––––––––––––––––––––––––––––––––––––––––––––––––––––––––––––––––––––––––––––––––––––––––––––––––––––––––––––––––––––––––––––––––––––––––––––––––––––
PROFIT AND LOSS ACCOUNT ($ million)
Total revenue 14,494.4 13,341.1 12,012.9 9,761.9 10,515.0
Total expenditure (13,180.0) (12,127.8) (10,695.8) (9,093.0) (9,797.9)
––––––––––––––––––––––––––––––––––––––––––––––––––––––––––––––––––––––––––––––––––––––––––
Operating profi t 1,314.4 1,213.3 1,317.1 668.9 717.1
Finance charges (124.1) (96.3) (77.5) (65.1) (54.7)
Interest income 181.8 96.7 52.7 32.5 33.7
Surplus on disposal of aircraft, spares and spare engines 237.9 115.7 215.2 102.7 144.9
Dividend from long-term investments, gross 38.8 24.6 8.0 3.6 5.2
Other non-operating items 77.9 12.3 9.8 5.2 (8.2)
Share of profi ts of joint venture companies 57.9 40.6 12.5 6.4 14.5
Share of profi ts/(losses) of associated companies 79.0 255.2 203.7 (39.0) 123.8
––––––––––––––––––––––––––––––––––––––––––––––––––––––––––––––––––––––––––––––––––––––––––
Profi t before exceptional items 1,863.6 1,662.1 1,741.5 715.2 976.3
Surplus on sale of SIA Building 223.3 – – – –
Surplus on sale of investment in Singapore Aircraft
Leasing Enterprise Pte Ltd 197.7 – – – –
Surplus on sale of investment in Air New Zealand Limited – – 45.7 – –
Surplus on sale of investment in Raffl es Holdings Ltd – – 32.6 – –
Surplus on sale of investment in Taikoo – – 9.0 – –
Surplus on liquidation of Abacus Distribution
Systems Pte Ltd – – – 9.2 –
Surplus on disposal of Aviation Software Development
Consultancy India Limited – – – 1.1 –
Staff compensation and restructuring of operations – – (37.8) (41.4) –
Surplus on liquidation of Asian Frequent Flyer Pte Ltd – – – – 0.5
––––––––––––––––––––––––––––––––––––––––––––––––––––––––––––––––––––––––––––––––––––––––––
Profi t before taxation 2,284.6 1,662.1 1,791.0 684.1 976.8
Profi t attributable to equity holders of the Company 2,128.8 1,240.7 1,352.4 750.0 1,064.8
––––––––––––––––––––––––––––––––––––––––––––––––––––––––––––––––––––––––––––––––––––––––––––––––––––––––––––––––––––––––––––––––––––––––––––––––––––––––––––––––
BALANCE SHEET ($ million)
Share capital 1,494.9 1,202.6 1,121.7 1,120.7 1,120.7
Reserves
Capital reserve 44.9 40.8 41.9 32.0 7.7
Foreign currency translation reserve (59.5) (30.5) 3.1 19.8 41.3
Share-based compensation reserve 97.3 81.8 48.4 11.5 –
Fair value reserve (45.5) 163.6 – – –
General reserve 13,567.9 12,012.3 11,127.2 10,183.3 9,539.1
––––––––––––––––––––––––––––––––––––––––––––––––––––––––––––––––––––––––––––––––––––––––––
Equity attributable to equity holders of the Company 15,100.0 13,470.6 12,342.3 11,367.3 10,708.8
––––––––––––––––––––––––––––––––––––––––––––––––––––––––––––––––––––––––––––––––––––––––––––––––––––––––––––––––––––––––––––––––––––––––––––––––––––––––––––––––
Minority interests 443.3 396.3 302.8 304.1 267.5
Deferred account 973.6 349.6 414.6 446.7 523.1
Deferred taxation 2,410.9 2,486.1 2,450.1 2,175.3 2,251.0
––––––––––––––––––––––––––––––––––––––––––––––––––––––––––––––––––––––––––––––––––––––––––––––––––––––––––––––––––––––––––––––––––––––––––––––––––––––––––––––––
Fixed assets 16,311.7 15,524.7 15,161.7 15,222.9 15,406.0
Intangible assets
R1
100.2 121.7 144.1 1.4 1.5
Associated companies 897.5 996.3 695.1 429.7 500.7
Joint venture companies 86.6 362.6 323.6 309.2 296.4
Long-term investments 43.3 425.9 476.3 475.2 569.6
Other receivables 303.9 – – – –
Current assets 8,248.8 5,938.3 4,943.9 3,463.8 2,409.8
––––––––––––––––––––––––––––––––––––––––––––––––––––––––––––––––––––––––––––––––––––––––––
Total assets 25,992.0 23,369.5 21,744.7 19,902.2 19,184.0
––––––––––––––––––––––––––––––––––––––––––––––––––––––––––––––––––––––––––––––––––––––––––––––––––––––––––––––––––––––––––––––––––––––––––––––––––––––––––––––––
Long-term liabilities 1,805.8 1,824.4 2,333.3 2,207.2 1,879.6
Current liabilities 5,258.4 4,842.5 3,901.6 3,401.6 3,554.0
––––––––––––––––––––––––––––––––––––––––––––––––––––––––––––––––––––––––––––––––––––––––––
Total liabilities 7,064.2 6,666.9 6,234.9 5,608.8 5,433.6
–––––––––––––––––––––––––––––––––––––––––––––––––––––––––––––––––––––––––––––––––––––––––––––––––––––––––––––––––––––––––––––––––––––––––––––––––––––––––––––––––––––––––––––––––––
R1 In accordance with the revised FRS 38: Intangible Assets, the Group has reclassifi ed the net book value of computer software from fi xed assets to intangible assets. The
comparatives for 2002-03 and 2003-04 have not been restated.