Singapore Airlines 2007 Annual Report Download - page 53
Download and view the complete annual report
Please find page 53 of the 2007 Singapore Airlines annual report below. You can navigate through the pages in the report by either clicking on the pages listed below, or by using the keyword search tool below to find specific information within the annual report.-
 1
1 -
2
-
3
-
4
-
5
-
6
-
7
-
8
-
9
-
10
-
11
-
12
-
13
-
14
-
15
-
16
-
17
-
18
-
19
-
20
-
21
-
22
-
23
-
24
-
25
-
26
-
27
-
28
-
29
-
30
-
31
-
32
-
33
-
34
-
35
-
36
-
37
-
38
-
39
-
40
-
41
-
42
-
 43
43 -
 44
44 -
 45
45 -
 46
46 -
 47
47 -
 48
48 -
 49
49 -
 50
50 -
 51
51 -
 52
52 -
 53
53 -
 54
54 -
 55
55 -
 56
56 -
 57
57 -
 58
58 -
 59
59 -
 60
60 -
 61
61 -
 62
62 -
 63
63 -
64
-
65
-
66
-
67
-
68
-
69
-
70
-
71
-
72
-
73
-
74
-
75
-
76
-
77
-
78
-
79
-
80
-
81
-
82
-
83
-
84
-
85
-
86
-
87
-
88
-
89
-
90
-
91
-
92
-
93
-
94
-
95
-
96
-
97
-
98
-
99
-
100
-
101
-
102
-
103
-
104
-
105
-
106
-
107
-
108
-
109
-
110
-
111
-
112
-
113
-
114
-
115
-
116
-
117
-
118
-
119
-
120
-
121
-
122
-
123
-
124
-
125
-
126
-
127
-
128
-
129
-
130
-
131
-
132
-
133
-
134
-
135
-
136
-
137
-
138
-
139
-
140
-
141
-
142
-
143
-
144
-
145
-
146
-
147
-
148
-
149
-
150
-
151
-
152
-
153
-
154
-
155
-
156
-
157
-
158
-
159
-
160
 |
 |

Singapore Airlines 51 Annual Report 2006-07
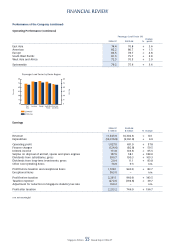
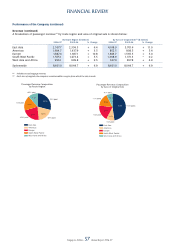
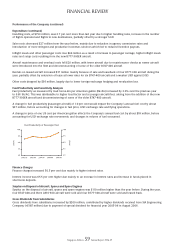
FINANCIAL REVIEW
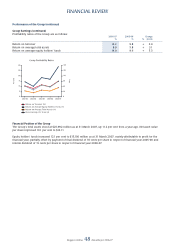
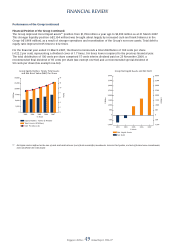
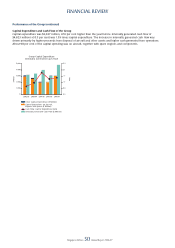
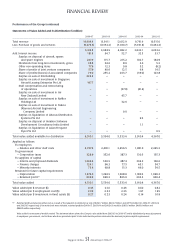
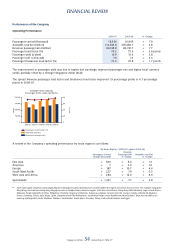
Performance of the Group (continued)
Statements of Value Added and its Distribution ($ million)
2006-07 2005-06 2004-05 2003-04 2002-03
–––––––––––––––––––––––––––––––––––––––––––––––––––––––––––––––––––––––––––––––––––––––––––––––––––––––––––––––––––––––––––––––––––––––––––––––––––––––––––––––––––––––––––––––––––
Total revenue 14,494.4 13,341.1 12,012.9 9,761.9 10,515.0
Less: Purchase of goods and services (9,078.6) (8,352.2) (7,030.7) (5,931.8) (6,462.4)
–––––––––––––––––––––––––––––––––––––––––––––––––––––––––––––––––––––––––––––––––––––––––––––––––––––––––––––––––––––––––––––––––––––––––––––––––––––––––––––––––––––––––––––––––––
5,415.8 4,988.9 4,982.2 3,830.1 4,052.6
Add: Interest income 181.8 96.7 52.7 32.5 33.7
Surplus on disposal of aircraft, spares
and spare engines 237.9 115.7 215.2 102.7 144.9
Dividends from long-term investments, gross 38.8 24.6 8.0 3.6 5.2
Other non-operating items 77.9 12.3 9.8 5.2 (8.2)
Share of profi ts of joint venture companies 57.9 40.6 12.5 6.4 14.5
Share of profi ts/(losses) of associated companies 79.0 255.2 203.7 (39.0) 123.8
Surplus on sale of SIA Building 223.3 – – – –
Surplus on sale of investment in Singapore
Aircraft Leasing Enterprise Pte Ltd 197.7 – – – –
Staff compensation and restructuring
of operations – – (37.8) (41.4) –
Surplus on sale of investment in Air
New Zealand Limited – – 45.7 – –
Surplus on sale of investment in Raffl es
Holdings Ltd – – 32.6 – –
Surplus on sale of investment in Taikoo
(Xiamen) Aircraft Engineering
Company Limited – – 9.0 – –
Surplus on liquidation of Abacus Distribution
Systems Pte Ltd – – – 9.2 –
Surplus on disposal of Aviation Software
Development Consultancy India Limited – – – 1.1 –
Surplus on liquidation of Asian Frequent
Flyer Pte Ltd – – – – 0.5
–––––––––––––––––––––––––––––––––––––––––––––––––––––––––––––––––––––––––––––––––––––––––––––––––––––––––––––––––––––––––––––––––––––––––––––––––––––––––––––––––––––––––––––––––––
Total value added available for distribution 6,510.1 5,534.0 5,533.6 3,910.4 4,367.0
–––––––––––––––––––––––––––––––––––––––––––––––––––––––––––––––––––––––––––––––––––––––––––––––––––––––––––––––––––––––––––––––––––––––––––––––––––––––––––––––––––––––––––––––––––
Applied as follows:
To employees
– Salaries and other staff costs 2,727.4 2,481.1 2,456.5 1,981.0 2,245.2
To government
– Corporation taxes 328.9 352.6 387.3 130.3 135.3
To suppliers of capital
– Interim and proposed dividends 1,245.2 550.5 487.4 304.5 166.6
– Finance charges 124.1 96.3 77.5 65.1 54.7
– Minority interests 73.6 68.8 51.3 46.0 54.5
Retained for future capital requirements
– Depreciation 1,374.0 1,294.5 1,208.6 1,180.2 1,090.3
– Retained profi t R1 636.9 690.2 865.0 203.3 620.4
–––––––––––––––––––––––––––––––––––––––––––––––––––––––––––––––––––––––––––––––––––––––––––––––––––––––––––––––––––––––––––––––––––––––––––––––––––––––––––––––––––––––––––––––––––
Total value added 6,510.1 5,534.0 5,533.6 3,910.4 4,367.0
–––––––––––––––––––––––––––––––––––––––––––––––––––––––––––––––––––––––––––––––––––––––––––––––––––––––––––––––––––––––––––––––––––––––––––––––––––––––––––––––––––––––––––––––––––
Value added per $ revenue ($) 0.45 0.41 0.46 0.40 0.42
Value added per $ employment cost ($) 2.39 2.23 2.25 1.97 1.95
Value added per $ investment in fi xed assets ($) 0.27 0.23 0.24 0.16 0.19
R1 Retained profi t excludes tax write-back as a result of the reduction in statutory tax rate of $246.7 million, $204.7 million and $277.8 million for 2006-07, 2003-04
and 2002-03 respectively. If tax write-back were included, retained profi t for 2006-07, 2003-04 and 2002-03 would be $883.6 million, $408.0 million and
$898.2 million respectively.
Value added is a measure of wealth created. The statement above shows the Group’s value added from 2002-03 to 2006-07 and its distribution by way of payments
to employees, government, and to those who have provided capital. It also indicates the portion retained in the business for future capital requirements.