Singapore Airlines 2007 Annual Report Download - page 48
Download and view the complete annual report
Please find page 48 of the 2007 Singapore Airlines annual report below. You can navigate through the pages in the report by either clicking on the pages listed below, or by using the keyword search tool below to find specific information within the annual report.-
 1
1 -
2
-
3
-
4
-
5
-
6
-
7
-
8
-
9
-
10
-
11
-
12
-
13
-
14
-
15
-
16
-
17
-
18
-
19
-
20
-
21
-
22
-
23
-
24
-
25
-
26
-
27
-
28
-
29
-
30
-
31
-
32
-
33
-
34
-
35
-
36
-
37
-
 38
38 -
 39
39 -
 40
40 -
 41
41 -
 42
42 -
 43
43 -
 44
44 -
 45
45 -
 46
46 -
 47
47 -
 48
48 -
 49
49 -
 50
50 -
 51
51 -
 52
52 -
 53
53 -
 54
54 -
 55
55 -
 56
56 -
 57
57 -
 58
58 -
59
-
60
-
61
-
62
-
63
-
64
-
65
-
66
-
67
-
68
-
69
-
70
-
71
-
72
-
73
-
74
-
75
-
76
-
77
-
78
-
79
-
80
-
81
-
82
-
83
-
84
-
85
-
86
-
87
-
88
-
89
-
90
-
91
-
92
-
93
-
94
-
95
-
96
-
97
-
98
-
99
-
100
-
101
-
102
-
103
-
104
-
105
-
106
-
107
-
108
-
109
-
110
-
111
-
112
-
113
-
114
-
115
-
116
-
117
-
118
-
119
-
120
-
121
-
122
-
123
-
124
-
125
-
126
-
127
-
128
-
129
-
130
-
131
-
132
-
133
-
134
-
135
-
136
-
137
-
138
-
139
-
140
-
141
-
142
-
143
-
144
-
145
-
146
-
147
-
148
-
149
-
150
-
151
-
152
-
153
-
154
-
155
-
156
-
157
-
158
-
159
-
160
 |
 |
Singapore Airlines 46 Annual Report 2006-07
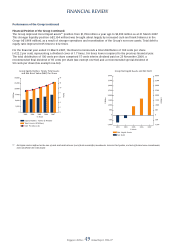
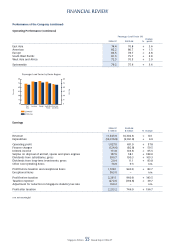
FINANCIAL REVIEW
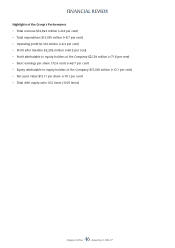
Highlights of the Group’s Performance
• Total revenue $14,494 million (+8.6 per cent)
• Total expenditure $13,180 million (+8.7 per cent)
• Operating profi t $1,314 million (+8.3 per cent)
• Profi t after taxation $2,202 million (+68.2 per cent)
• Profi t attributable to equity holders of the Company $2,129 million (+71.6 per cent)
• Basic earnings per share 172.6 cents (+69.7 per cent)
• Equity attributable to equity holders of the Company $15,100 million (+12.1 per cent)
• Net asset value $12.11 per share (+10.1 per cent)
• Total debt equity ratio 0.12 times (-0.05 times)