Singapore Airlines 2007 Annual Report Download - page 138
Download and view the complete annual report
Please find page 138 of the 2007 Singapore Airlines annual report below. You can navigate through the pages in the report by either clicking on the pages listed below, or by using the keyword search tool below to find specific information within the annual report.-
 1
1 -
2
-
3
-
4
-
5
-
6
-
7
-
8
-
9
-
10
-
11
-
12
-
13
-
14
-
15
-
16
-
17
-
18
-
19
-
20
-
21
-
22
-
23
-
24
-
25
-
26
-
27
-
28
-
29
-
30
-
31
-
32
-
33
-
34
-
35
-
36
-
37
-
38
-
39
-
40
-
41
-
42
-
43
-
44
-
45
-
46
-
47
-
48
-
49
-
50
-
51
-
52
-
53
-
54
-
55
-
56
-
57
-
58
-
59
-
60
-
61
-
62
-
63
-
64
-
65
-
66
-
67
-
68
-
69
-
70
-
71
-
72
-
73
-
74
-
75
-
76
-
77
-
78
-
79
-
80
-
81
-
82
-
83
-
84
-
85
-
86
-
87
-
88
-
89
-
90
-
91
-
92
-
93
-
94
-
95
-
96
-
97
-
98
-
99
-
100
-
101
-
102
-
103
-
104
-
105
-
106
-
107
-
108
-
109
-
110
-
111
-
112
-
113
-
114
-
115
-
116
-
117
-
118
-
119
-
120
-
121
-
122
-
123
-
124
-
125
-
126
-
127
-
 128
128 -
 129
129 -
 130
130 -
 131
131 -
 132
132 -
 133
133 -
 134
134 -
 135
135 -
 136
136 -
 137
137 -
 138
138 -
 139
139 -
 140
140 -
 141
141 -
 142
142 -
 143
143 -
 144
144 -
 145
145 -
 146
146 -
 147
147 -
 148
148 -
149
-
150
-
151
-
152
-
153
-
154
-
155
-
156
-
157
-
158
-
159
-
160
 |
 |

NOTES TO THE FINANCIAL STATEMENTS
31 March 2007
Singapore Airlines 136 Annual Report 2006-07
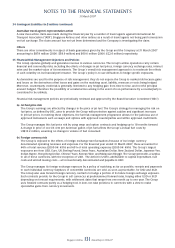
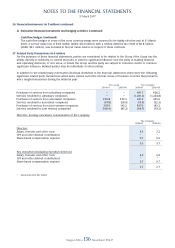
36 Financial Instruments (in $ million) (continued)
(c) Derivative fi nancial instruments and hedging activities (continued)
Cash fl ow hedges (continued)
The cash fl ow hedges of some of the cross currency swaps were assessed to be highly effective and at 31 March
2007, a net fair value loss of $3.8 million (2006: $0.3 million), with a related deferred tax credit of $0.8 million
(2006: $0.1 million), was included in the fair value reserve in respect of these contracts.
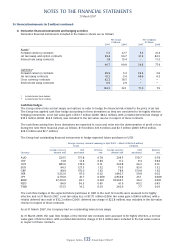
37 Related Party Transactions (in $ million)
For the purposes of these fi nancial statements, parties are considered to be related to the Group if the Group has the
ability, directly or indirectly, to control the party or exercise signifi cant infl uence over the party in making fi nancial
and operating decisions, or vice versa, or where the Group and the party are subject to common control or common
signifi cant infl uence. Related parties may be individuals or other entities.
In addition to the related party information disclosed elsewhere in the fi nancial statements, these were the following
signifi cant related party transactions which were carried out in the normal course of business on terms that prevail in
arm’s length transactions during the fi nancial year:
The Group The Company
2006-07 2005-06 2006-07 2005-06
––––––––––––––––––––––––––––––––––––––––––––––––––––––––––––––––––––––––––––––––––––––––––––––––––––––––––––––––––––––––––––––––––––––––––––––––––––––––––––
Purchases of services from subsidiary companies – – 691.7 609.2
Services rendered to subsidiary companies – – (1,261.2) (1,224.8)
Purchases of services from associated companies 259.8 235.3 241.3 225.0
Services rendered to associated companies (67.8) (28.9) (19.5) (22.3)
Purchases of services from joint venture companies 397.0 143.2 397.0 143.2
Services rendered to joint venture companies (108.9) (85.2) (99.7) (78.2)
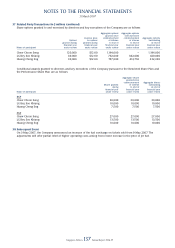
Directors’ and key executives’ remuneration of the Company
The Company
2006-07 2005-06
––––––––––––––––––––––––––––––––––––––––––––––––––––––––––––––––––––––––––––––––––––––––––––––––––––––––––––––––––––––––––––––––––––––––––––––––––––––––––––
Directors
Salary, bonuses and other costs 4.3 3.2
CPF and other defi ned contributions * *
Share-based compensation expense 0.7 0.5
––––––––––––––––––––––––––––––––––––
5.0 3.7
––––––––––––––––––––––––––––––––––––
Key executives (excluding executive directors)
Salary, bonuses and other costs 2.0 2.0
CPF and other defi ned contributions * *
Share-based compensation expense 0.7 0.7
––––––––––––––––––––––––––––––––––––
2.7 2.7
––––––––––––––––––––––––––––––––––––
* Amount less than $0.1 million