Singapore Airlines 2007 Annual Report Download - page 58
Download and view the complete annual report
Please find page 58 of the 2007 Singapore Airlines annual report below. You can navigate through the pages in the report by either clicking on the pages listed below, or by using the keyword search tool below to find specific information within the annual report.-
 1
1 -
2
-
3
-
4
-
5
-
6
-
7
-
8
-
9
-
10
-
11
-
12
-
13
-
14
-
15
-
16
-
17
-
18
-
19
-
20
-
21
-
22
-
23
-
24
-
25
-
26
-
27
-
28
-
29
-
30
-
31
-
32
-
33
-
34
-
35
-
36
-
37
-
38
-
39
-
40
-
41
-
42
-
43
-
44
-
45
-
46
-
47
-
 48
48 -
 49
49 -
 50
50 -
 51
51 -
 52
52 -
 53
53 -
 54
54 -
 55
55 -
 56
56 -
 57
57 -
 58
58 -
 59
59 -
 60
60 -
 61
61 -
 62
62 -
 63
63 -
 64
64 -
 65
65 -
 66
66 -
 67
67 -
 68
68 -
69
-
70
-
71
-
72
-
73
-
74
-
75
-
76
-
77
-
78
-
79
-
80
-
81
-
82
-
83
-
84
-
85
-
86
-
87
-
88
-
89
-
90
-
91
-
92
-
93
-
94
-
95
-
96
-
97
-
98
-
99
-
100
-
101
-
102
-
103
-
104
-
105
-
106
-
107
-
108
-
109
-
110
-
111
-
112
-
113
-
114
-
115
-
116
-
117
-
118
-
119
-
120
-
121
-
122
-
123
-
124
-
125
-
126
-
127
-
128
-
129
-
130
-
131
-
132
-
133
-
134
-
135
-
136
-
137
-
138
-
139
-
140
-
141
-
142
-
143
-
144
-
145
-
146
-
147
-
148
-
149
-
150
-
151
-
152
-
153
-
154
-
155
-
156
-
157
-
158
-
159
-
160
 |
 |
Singapore Airlines 56 Annual Report 2006-07
FINANCIAL REVIEW
Performance of the Company (continued)
Revenue
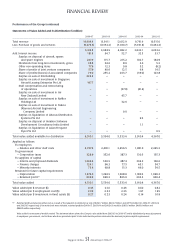
The Company’s revenue increased 10.1 per cent to $11,344 million as follows:
2006-07 2005-06
$ million $ million % Change
–––––––––––––––––––––––––––––––––––––––––––––––––––––––––––––––––––––––––––––––––––––––––––––––––––––––––––––––––––––––––––––––––––––––––––––––––––––––––––––––––––––––––––––––––––
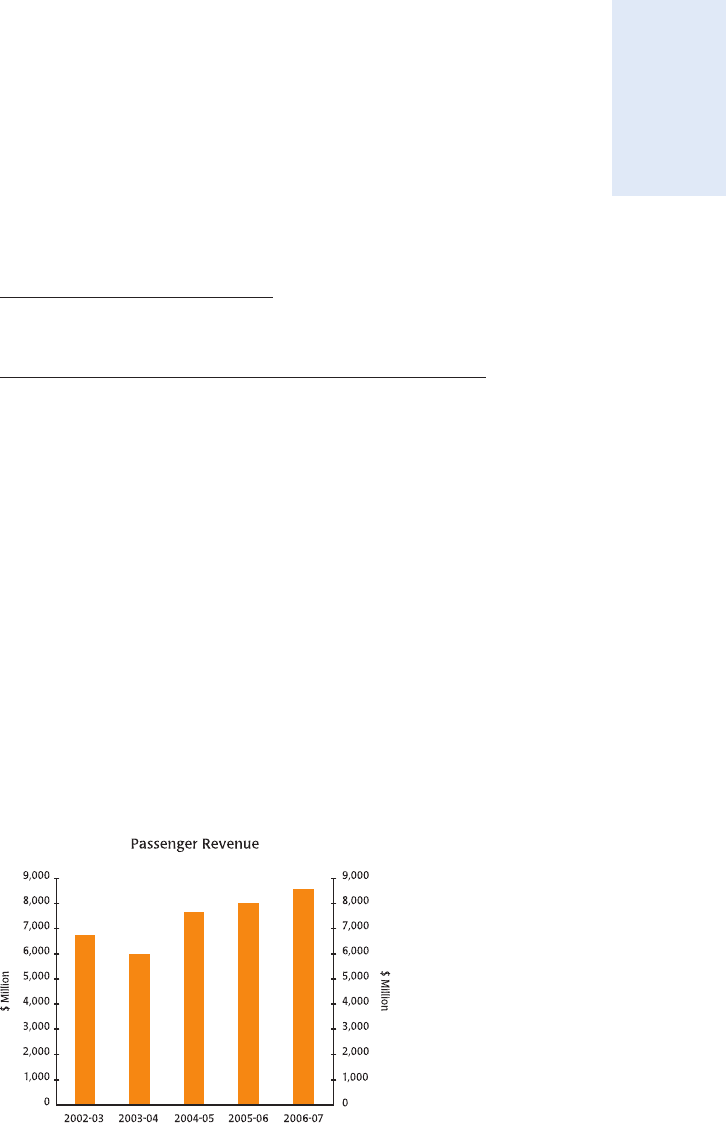
Passenger revenue 8,573.4 8,021.9 + 6.9
Excess baggage revenue 27.6 22.8 + 21.1
Non-scheduled services 4.5 11.6 – 61.2
Bellyhold revenue from SIA Cargo 1,157.3 1,130.8 + 2.3
––––––––––––––––––––––––––––––––––––––––––––––––––––––––––––––––––
Direct operating revenue 9,762.8 9,187.1 + 6.3
Indirect operating revenue 1,581.1 1,115.7 + 41.7
––––––––––––––––––––––––––––––––––––––––––––––––––––––––––––––––––
Total operating revenue 11,343.9 10,302.8 + 10.1
–––––––––––––––––––––––––––––––––––––––––––––––––––––––––––––––––––––––––––––––––––––––––––––––––––––––––––––––––––––––––––––––––––––––––––––––––––––––––––––––––––––––––––––––––––
The increase in passenger revenue was the result of:
$ million $ million
–––––––––––––––––––––––––––––––––––––––––––––––––––––––––––––––––––––––––––––––––––––––––––––––––––––––––––––––––––––––––––––––––––––––––––––––––––––––––––––––––––––––––––––––––––
7.7% increase in passenger traffi c:
2.8% increase in seat capacity + 224.3
3.6% points increase in passenger load factor + 392.5 + 616.8
––––––––––––––––––
1.0% decrease in passenger yield (excluding fuel surcharge):
Change in passenger mix + 154.9
Higher local currency yields + 108.2
Stronger SGD – 328.4 – 65.3
––––––––––––––––––––––––––––––––––––––––––––––––
Increase in passenger revenue + 551.5
–––––––––––––––––––––––––––––––––––––––––––––––––––––––––––––––––––––––––––––––––––––––––––––––––––––––––––––––––––––––––––––––––––––––––––––––––––––––––––––––––––––––––––––––––––
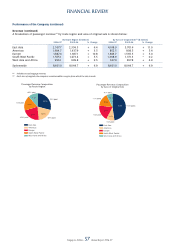
Bellyhold revenue increased 2.3 per cent to $1,157 million due to higher net bellyhold capacity (+5.5 per cent) because of
increased passenger operations and recovery of higher fuel costs from SIA Cargo.
Indirect operating revenue increased 41.7 per cent to $1,581 million. This was mainly due to higher fuel surcharge, higher
other incidental revenue, partially offset by lower rental income and income from lease of aircraft.
The sensitivity of passenger revenue to a one percentage point change in passenger load factor and a one percentage
change in passenger yield is as follows:
$ million
–––––––––––––––––––––––––––––––––––––––––––––––––––––––––––––––––––––––––––––––––––––––––––––––––––––––––––––––––––––––––––––––––––––––––––––––––––––––––––––––––––––––––––––––––––
1.0% point change in passenger load factor, if yield and seat capacity remain constant 108
1.0% change in passenger yield, if passenger traffi c remains constant 86
–––––––––––––––––––––––––––––––––––––––––––––––––––––––––––––––––––––––––––––––––––––––––––––––––––––––––––––––––––––––––––––––––––––––––––––––––––––––––––––––––––––––––––––––––––