Singapore Airlines 2007 Annual Report Download - page 62
Download and view the complete annual report
Please find page 62 of the 2007 Singapore Airlines annual report below. You can navigate through the pages in the report by either clicking on the pages listed below, or by using the keyword search tool below to find specific information within the annual report.-
 1
1 -
2
-
3
-
4
-
5
-
6
-
7
-
8
-
9
-
10
-
11
-
12
-
13
-
14
-
15
-
16
-
17
-
18
-
19
-
20
-
21
-
22
-
23
-
24
-
25
-
26
-
27
-
28
-
29
-
30
-
31
-
32
-
33
-
34
-
35
-
36
-
37
-
38
-
39
-
40
-
41
-
42
-
43
-
44
-
45
-
46
-
47
-
48
-
49
-
50
-
51
-
 52
52 -
 53
53 -
 54
54 -
 55
55 -
 56
56 -
 57
57 -
 58
58 -
 59
59 -
 60
60 -
 61
61 -
 62
62 -
 63
63 -
 64
64 -
 65
65 -
 66
66 -
 67
67 -
 68
68 -
 69
69 -
 70
70 -
 71
71 -
 72
72 -
73
-
74
-
75
-
76
-
77
-
78
-
79
-
80
-
81
-
82
-
83
-
84
-
85
-
86
-
87
-
88
-
89
-
90
-
91
-
92
-
93
-
94
-
95
-
96
-
97
-
98
-
99
-
100
-
101
-
102
-
103
-
104
-
105
-
106
-
107
-
108
-
109
-
110
-
111
-
112
-
113
-
114
-
115
-
116
-
117
-
118
-
119
-
120
-
121
-
122
-
123
-
124
-
125
-
126
-
127
-
128
-
129
-
130
-
131
-
132
-
133
-
134
-
135
-
136
-
137
-
138
-
139
-
140
-
141
-
142
-
143
-
144
-
145
-
146
-
147
-
148
-
149
-
150
-
151
-
152
-
153
-
154
-
155
-
156
-
157
-
158
-
159
-
160
 |
 |

Singapore Airlines 60 Annual Report 2006-07
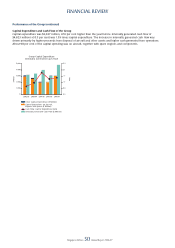
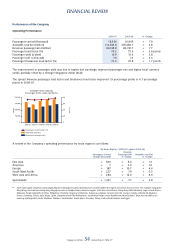
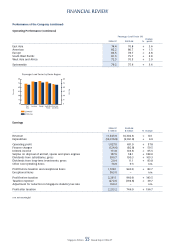
Performance of the Company (continued)
Exceptional Items
Exceptional items comprised surplus on sale of the 35.5% equity stake in Singapore Aircraft Leasing Enterprise Pte Ltd (SALE)
of $340 million and surplus on sale of SIA Building of $223 million.
Taxation
There was a net tax charge of $78 million, comprising of a taxation expense of $272 million on current year’s profi t and a
write-back of $194 million on prior years’ deferred tax liabilities arising from the 2 percentage points reduction in statutory
tax rate. The current year’s tax charge of $272 million comprised deferred tax of $238 million and current tax of $34 million.
As at 31 March 2007, the company’s deferred taxation account stood at $1,982 million.
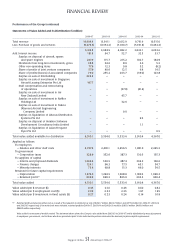
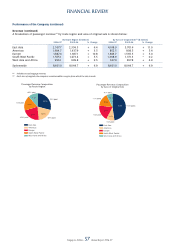
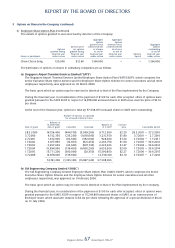
Average Staff Strength and Productivity
The Company’s average staff strength was 13,847, an increase of 118 over the previous year. The distribution of employee
strength by category and location is as follows:
2006-07 2005-06 % Change
–––––––––––––––––––––––––––––––––––––––––––––––––––––––––––––––––––––––––––––––––––––––––––––––––––––––––––––––––––––––––––––––––––––––––––––––––––––––––––––––––––––––––––––––––––
Category
Senior staff (administrative and higher ranking offi cers) 1,316 1,284 + 2.5
Technical crew 2,128 2,024 + 5.1
Cabin crew 6,836 6,784 + 0.8
Other ground staff 3,567 3,637 – 1.9
––––––––––––––––––––––––––––––––––––––––––––––––––––––––––––––––––
13,847 13,729 + 0.9
–––––––––––––––––––––––––––––––––––––––––––––––––––––––––––––––––––––––––––––––––––––––––––––––––––––––––––––––––––––––––––––––––––––––––––––––––––––––––––––––––––––––––––––––––––
Location
Singapore 11,613 11,452 + 1.4
East Asia 945 974 – 3.0
Europe 419 435 – 3.7
South West Pacifi c 369 370 – 0.3
West Asia and Africa 263 256 + 2.7
Americas 238 242 – 1.7
––––––––––––––––––––––––––––––––––––––––––––––––––––––––––––––––––
13,847 13,729 + 0.9
–––––––––––––––––––––––––––––––––––––––––––––––––––––––––––––––––––––––––––––––––––––––––––––––––––––––––––––––––––––––––––––––––––––––––––––––––––––––––––––––––––––––––––––––––––
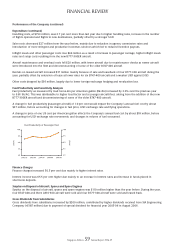
The Company’s average staff productivity ratios are shown below:
2006-07 2005-06 % Change
–––––––––––––––––––––––––––––––––––––––––––––––––––––––––––––––––––––––––––––––––––––––––––––––––––––––––––––––––––––––––––––––––––––––––––––––––––––––––––––––––––––––––––––––––––
Seat capacity per employee (seat-km) 8,127,667 7,974,630 + 1.9
Passenger load carried per employee (tonne-km) 613,211 577,784 + 6.1
Revenue per employee ($) 819,232 750,441 + 9.2
Value added per employee ($) 368,831 258,810 + 42.5
–––––––––––––––––––––––––––––––––––––––––––––––––––––––––––––––––––––––––––––––––––––––––––––––––––––––––––––––––––––––––––––––––––––––––––––––––––––––––––––––––––––––––––––––––––
Issued Share Capital and Share Options
There was no buyback of the Company’s shares during the period under review.
Employee Share Option Plan
On 3 July 2006, the Company made an eighth grant of share options to employees. Staff accepted 12,777,119 share options
to be exercised between 3 July 2007 and 2 July 2016.
During the year, 22,128,620 share options were exercised by employees. As at 31 March 2007, there were 68,338,907
unexercised employee share options.
FINANCIAL REVIEW