Singapore Airlines 2007 Annual Report Download - page 64
Download and view the complete annual report
Please find page 64 of the 2007 Singapore Airlines annual report below. You can navigate through the pages in the report by either clicking on the pages listed below, or by using the keyword search tool below to find specific information within the annual report.-
 1
1 -
2
-
3
-
4
-
5
-
6
-
7
-
8
-
9
-
10
-
11
-
12
-
13
-
14
-
15
-
16
-
17
-
18
-
19
-
20
-
21
-
22
-
23
-
24
-
25
-
26
-
27
-
28
-
29
-
30
-
31
-
32
-
33
-
34
-
35
-
36
-
37
-
38
-
39
-
40
-
41
-
42
-
43
-
44
-
45
-
46
-
47
-
48
-
49
-
50
-
51
-
52
-
53
-
 54
54 -
 55
55 -
 56
56 -
 57
57 -
 58
58 -
 59
59 -
 60
60 -
 61
61 -
 62
62 -
 63
63 -
 64
64 -
 65
65 -
 66
66 -
 67
67 -
 68
68 -
 69
69 -
 70
70 -
 71
71 -
 72
72 -
 73
73 -
 74
74 -
75
-
76
-
77
-
78
-
79
-
80
-
81
-
82
-
83
-
84
-
85
-
86
-
87
-
88
-
89
-
90
-
91
-
92
-
93
-
94
-
95
-
96
-
97
-
98
-
99
-
100
-
101
-
102
-
103
-
104
-
105
-
106
-
107
-
108
-
109
-
110
-
111
-
112
-
113
-
114
-
115
-
116
-
117
-
118
-
119
-
120
-
121
-
122
-
123
-
124
-
125
-
126
-
127
-
128
-
129
-
130
-
131
-
132
-
133
-
134
-
135
-
136
-
137
-
138
-
139
-
140
-
141
-
142
-
143
-
144
-
145
-
146
-
147
-
148
-
149
-
150
-
151
-
152
-
153
-
154
-
155
-
156
-
157
-
158
-
159
-
160
 |
 |

Singapore Airlines 62 Annual Report 2006-07
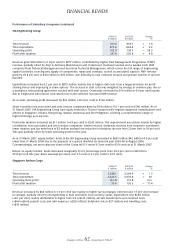
Performance of Subsidiary Companies (continued)
SIA Engineering Group
2006-07 2005-06 Change
$ million $ million %
–––––––––––––––––––––––––––––––––––––––––––––––––––––––––––––––––––––––––––––––––––––––––––––––––––––––––––––––––––––––––––––––––––––––––––––––––––––––––––––––––––––––––––––––––––
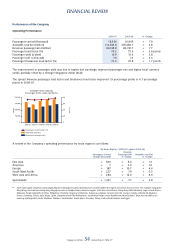
Total revenue 977.4 959.1 + 1.9
Total expenditure 875.4 824.4 + 6.2
Operating profi t 102.0 134.7 – 24.3
Profi t after taxation 241.6 230.4 + 4.9
–––––––––––––––––––––––––––––––––––––––––––––––––––––––––––––––––––––––––––––––––––––––––––––––––––––––––––––––––––––––––––––––––––––––––––––––––––––––––––––––––––––––––––––––––––
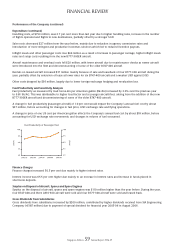
Revenue grew $18 million (+1.9 per cent) to $977 million, contributed by higher Fleet Management Programme (“FMP”)
revenue, partially offset by drop in Airframe Maintenance and Component Overhaul revenue and a weaker USD. FMP
comprises Fleet Technical Management and Inventory Technical Management, which covers the full range of engineering
support activities, sourcing and supply of components, repair and overhaul, as well as associated logistics. FMP revenue
grew by 65.8 per cent or $30 million to $76 million, due primarily to new contracts secured and greater number of aircraft
handled.
Expenditure increased by 6.2 per cent to $875 million mainly due to higher staff costs from a larger provision for profi t-
sharing bonus and expensing of share options. The increase in staff costs was mitigated by savings in overtime pay, due to
a workplace restructuring agreement reached with staff unions. Overheads increased by $14 million (+6.6 per cent) mainly
due to freight and subcontract costs which rose in line with the increased FMP revenue.
As a result, operating profi t decreased by $33 million (-24.3 per cent) to $102 million.
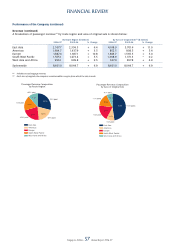
Share of profi ts from associated and joint venture companies grew by $34 million (+32.1 per cent) to $140 million. As at
31 March 2007, SIA Engineering Group had equity interests in 19 joint ventures with original equipment manufacturers and
airlines in Singapore, Ireland, Hong Kong, Taiwan, Indonesia and the Philippines, covering a comprehensive range of
high-technology aero-services.
Profi t after taxation increased by $11 million (+4.9 per cent) to $242 million. The improvement was driven mainly by higher
contribution from associated and joint venture companies, interest income, dividends received from long-term investment,
lower taxation and tax write-back of $2 million arising from reduction in statutory tax rate from 20 per cent to 18 per cent.
This was partially offset by lower operating profi t for the year.
As at 31 March 2007, equity holders’ funds of the SIA Engineering Group amounted to $997 million, $42 million (-4.0 per cent)
lower than 31 March 2006 due to the payment of a special dividend for fi nancial year 2005-06 in August 2006.
Correspondingly, net asset value per share of the Group fell 6.3 cents (-6.3 per cent) to 93.9 cents as at 31 March 2007.
Return on equity holders’ funds decreased marginally by 0.5 percentage point from 24.3 per cent in 2005-06 to
23.8 per cent this year. Basic earnings per share rose 0.5 cents (+2.2 per cent) to 23.0 cents.
Singapore Airlines Cargo
2006-07 2005-06 Change
$ million $ million %
–––––––––––––––––––––––––––––––––––––––––––––––––––––––––––––––––––––––––––––––––––––––––––––––––––––––––––––––––––––––––––––––––––––––––––––––––––––––––––––––––––––––––––––––––––
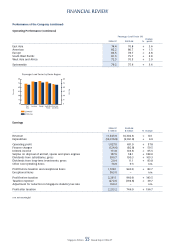
Total revenue 3,288.1 3,244.6 + 1.3
Total expenditure 3,320.5 3,070.8 + 8.1
Operating (loss)/profi t (32.4) 173.8 n.m.
Profi t after taxation 30.6 135.3 – 77.4
–––––––––––––––––––––––––––––––––––––––––––––––––––––––––––––––––––––––––––––––––––––––––––––––––––––––––––––––––––––––––––––––––––––––––––––––––––––––––––––––––––––––––––––––––––
Revenue increased by $44 million (+1.3 per cent) due mainly to higher fuel surcharges collected and 1.5 per cent increase
in carriage, partially offset by strengthening of SGD and lower local currency yields. Expenditure rose $250 million
(+8.1 per cent), mainly attributable to higher fuel cost (+$132 million), aircraft maintenance and overhaul costs
(+$46 million), payroll costs and staff expenses (+$29 million), bellyhold costs (+$27 million) and handling costs
(+$19 million).
FINANCIAL REVIEW