Singapore Airlines 2007 Annual Report Download - page 112
Download and view the complete annual report
Please find page 112 of the 2007 Singapore Airlines annual report below. You can navigate through the pages in the report by either clicking on the pages listed below, or by using the keyword search tool below to find specific information within the annual report.-
 1
1 -
2
-
3
-
4
-
5
-
6
-
7
-
8
-
9
-
10
-
11
-
12
-
13
-
14
-
15
-
16
-
17
-
18
-
19
-
20
-
21
-
22
-
23
-
24
-
25
-
26
-
27
-
28
-
29
-
30
-
31
-
32
-
33
-
34
-
35
-
36
-
37
-
38
-
39
-
40
-
41
-
42
-
43
-
44
-
45
-
46
-
47
-
48
-
49
-
50
-
51
-
52
-
53
-
54
-
55
-
56
-
57
-
58
-
59
-
60
-
61
-
62
-
63
-
64
-
65
-
66
-
67
-
68
-
69
-
70
-
71
-
72
-
73
-
74
-
75
-
76
-
77
-
78
-
79
-
80
-
81
-
82
-
83
-
84
-
85
-
86
-
87
-
88
-
89
-
90
-
91
-
92
-
93
-
94
-
95
-
96
-
97
-
98
-
99
-
100
-
101
-
 102
102 -
 103
103 -
 104
104 -
 105
105 -
 106
106 -
 107
107 -
 108
108 -
 109
109 -
 110
110 -
 111
111 -
 112
112 -
 113
113 -
 114
114 -
 115
115 -
 116
116 -
 117
117 -
 118
118 -
 119
119 -
 120
120 -
 121
121 -
 122
122 -
123
-
124
-
125
-
126
-
127
-
128
-
129
-
130
-
131
-
132
-
133
-
134
-
135
-
136
-
137
-
138
-
139
-
140
-
141
-
142
-
143
-
144
-
145
-
146
-
147
-
148
-
149
-
150
-
151
-
152
-
153
-
154
-
155
-
156
-
157
-
158
-
159
-
160
 |
 |

NOTES TO THE FINANCIAL STATEMENTS
31 March 2007
Singapore Airlines 110 Annual Report 2006-07
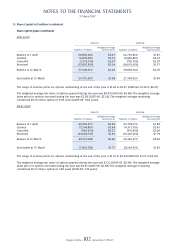
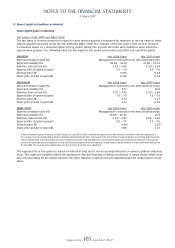
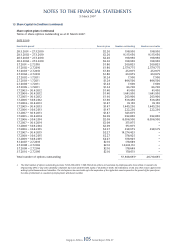
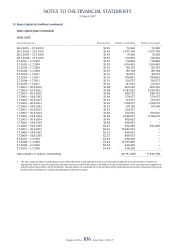
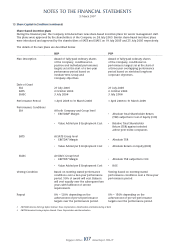
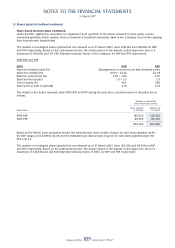
13 Share Capital (in $ million) (continued)
Share-based incentive plans (continued)
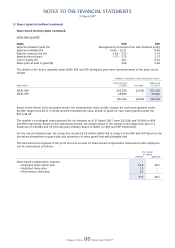
SIAEC RSP and PSP
SIAEC RSP PSP
Expected dividend yield (%) Management’s forecast in line with dividend policy
Expected volatility (%) 16.82 – 22.31 17.49
Risk-free interest rate (%) 2.99 – 3.25 3.16
Expected term (years) 1.75 – 3.75 2.75
Cost of equity (%) N.A. 8.50
Share price at date of grant ($) 3.96 3.96
The details of the shares awarded under SIAEC RSP and PSP during the year since commencement of the plans are as
follows:
Number of Restricted and Performance shares
––––––––––––––––––––––––––––––––––––––––––––––––––––––
Date of grant Balance at
Share Plans 3.7.2006 Cancelled 31.3.2007
–––––––––––––––––––––––––––––––––––––––––––––––––––––––––––––––––––––––––––––––––––––––––––––––––––––––––––––––––––––––––––––––––––––––––––––––––––––––––––––
SIAEC RSP 205,200 (2,000) 203,200
SIAEC PSP 36,900 – 36,900
––––––––––––––––––––––––––––––––––––––––––––––––––––––
242,100 (2,000) 240,100
––––––––––––––––––––––––––––––––––––––––––––––––––––––
Based on the Monte Carlo simulation model, the estimated fair value at date of grant for each share granted under
the RSP ranges from $3.71 to $3.84 and the estimated fair value at date of grant for each share granted under the
PSP is $4.04.
The number of contingent shares granted but not released as at 31 March 2007, were 203,200 and 36,900 for RSP
and PSP respectively. Based on the achievement factor, the actual release of the awards could range from zero to a
maximum of 243,840 and 55,350 fully-paid ordinary shares of SIAEC, for RSP and PSP respectively.
For the current fi nancial year, the Group has recorded $1.8 million (2006: Nil) in respect of the RSP and PSP based on the
fair values determined on grant date and estimation of share grants that will ultimately vest.
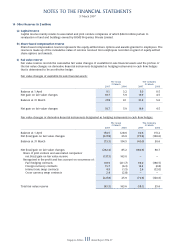
The total amount recognised in the profi t and loss account for share-based compensation transactions with employees
can be summarised as follows:
The Group
31 March
2006-07 2005-06
–––––––––––––––––––––––––––––––––––––––––––––––––––––––––––––––––––––––––––––––––––––––––––––––––––––––––––––––––––––––––––––––––––––––––––––––––––––––––––––––––––––
Share-based compensation expense
– Employee share option plan 55.8 48.1
– Restricted share plan 1.5 –
– Performance share plan 0.3 –
––––––––––––––––––––––––––––––––––––
57.6 48.1
––––––––––––––––––––––––––––––––––––