Singapore Airlines 2007 Annual Report Download - page 128
Download and view the complete annual report
Please find page 128 of the 2007 Singapore Airlines annual report below. You can navigate through the pages in the report by either clicking on the pages listed below, or by using the keyword search tool below to find specific information within the annual report.-
 1
1 -
2
-
3
-
4
-
5
-
6
-
7
-
8
-
9
-
10
-
11
-
12
-
13
-
14
-
15
-
16
-
17
-
18
-
19
-
20
-
21
-
22
-
23
-
24
-
25
-
26
-
27
-
28
-
29
-
30
-
31
-
32
-
33
-
34
-
35
-
36
-
37
-
38
-
39
-
40
-
41
-
42
-
43
-
44
-
45
-
46
-
47
-
48
-
49
-
50
-
51
-
52
-
53
-
54
-
55
-
56
-
57
-
58
-
59
-
60
-
61
-
62
-
63
-
64
-
65
-
66
-
67
-
68
-
69
-
70
-
71
-
72
-
73
-
74
-
75
-
76
-
77
-
78
-
79
-
80
-
81
-
82
-
83
-
84
-
85
-
86
-
87
-
88
-
89
-
90
-
91
-
92
-
93
-
94
-
95
-
96
-
97
-
98
-
99
-
100
-
101
-
102
-
103
-
104
-
105
-
106
-
107
-
108
-
109
-
110
-
111
-
112
-
113
-
114
-
115
-
116
-
117
-
 118
118 -
 119
119 -
 120
120 -
 121
121 -
 122
122 -
 123
123 -
 124
124 -
 125
125 -
 126
126 -
 127
127 -
 128
128 -
 129
129 -
 130
130 -
 131
131 -
 132
132 -
 133
133 -
 134
134 -
 135
135 -
 136
136 -
 137
137 -
 138
138 -
139
-
140
-
141
-
142
-
143
-
144
-
145
-
146
-
147
-
148
-
149
-
150
-
151
-
152
-
153
-
154
-
155
-
156
-
157
-
158
-
159
-
160
 |
 |

NOTES TO THE FINANCIAL STATEMENTS
31 March 2007
Singapore Airlines 126 Annual Report 2006-07
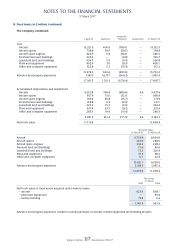
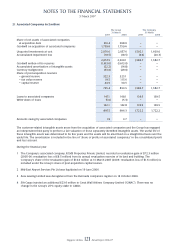
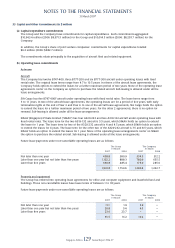
25 Stocks (in $ million)
The Group The Company
31 March 31 March
2007 2006 2007 2006
––––––––––––––––––––––––––––––––––––––––––––––––––––––––––––––––––––––––––––––––––––––––––––––––––––––––––––––––––––––––––––––––––––––––––––––––––––––––––––––––
Technical stocks and stores 473.4 472.8 436.5 441.5
Catering and general stocks 24.3 26.1 16.0 17.0
Work-in-progress 36.4 18.6 – –
––––––––––––––––––––––––––––––––––––––––––––––––––––––––––––––––––––––––
Total inventories at lower of cost and net realisable value 534.1 517.5 452.5 458.5
––––––––––––––––––––––––––––––––––––––––––––––––––––––––––––––––––––––––
During the fi nancial year, the Group wrote down $12.6 million (2005-06: $1.1 million) of stocks which are recognised as
expense in the profi t and loss account.
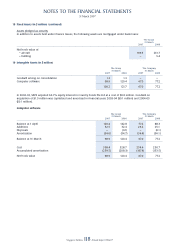
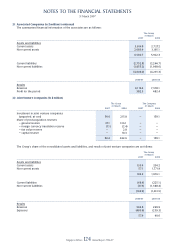
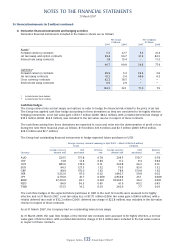
26 Trade Debtors (in $ million)
Trade debtors are stated after accumulated impairment losses. An analysis of the accumulated impairment losses is as
follows:
The Group The Company
31 March 31 March
2007 2006 2007 2006
–––––––––––––––––––––––––––––––––––––––––––––––––––––––––––––––––––––––––––––––––––––––––––––––––––––––––––––––––––––––––––––––––––––––––––––––––––––––––––––––
Balance at 1 April 20.9 16.5 6.2 3.3
(Written back)/Charged during the year (5.5) 5.0 (1.9) 2.9
Written-off during the year (1.0) (0.6) – –
––––––––––––––––––––––––––––––––––––––––––––––––––––––––––––––––––––––––
Balance at 31 March 14.4 20.9 4.3 6.2
––––––––––––––––––––––––––––––––––––––––––––––––––––––––––––––––––––––––
Bad debts written-off directly to
profi t and loss account, net of debts recovered 1.8 1.8 0.9 1.5
––––––––––––––––––––––––––––––––––––––––––––––––––––––––––––––––––––––––
As at 31 March 2007, the composition of trade debtors held in foreign currencies by the Group is as follows:
USD – 19.8% (2006: 22.2%), AUD – 5.8% (2006: 4.0%), EUR – 5.2% (2006: 6.2%) and JPY – 4.9% (2006: 5.8%).
There was no loan to directors of the Company and its subsidiary companies in accordance with schemes approved by
shareholders of the Company (2006: $0.1 million).
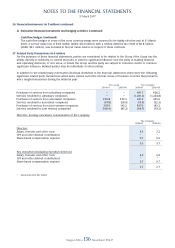
27 Investments (in $ million)
The Group The Company
31 March 31 March
2007 2006 2007 2006
–––––––––––––––––––––––––––––––––––––––––––––––––––––––––––––––––––––––––––––––––––––––––––––––––––––––––––––––––––––––––––––––––––––––––––––––––––––––––––––––
Available-for-sale investments
Quoted investments
Government securities 4.5 13.1 – –
Equity investments 33.0 28.2 – –
Non-equity investments 485.0 356.3 467.0 346.1
––––––––––––––––––––––––––––––––––––––––––––––––––––––––––––––––––––––––
522.5 397.6 467.0 346.1
––––––––––––––––––––––––––––––––––––––––––––––––––––––––––––––––––––––––
Unquoted investments
Non-equity investments 73.5 48.9 – –
––––––––––––––––––––––––––––––––––––––––––––––––––––––––––––––––––––––––
73.5 48.9 – –
––––––––––––––––––––––––––––––––––––––––––––––––––––––––––––––––––––––––
596.0 446.5 467.0 346.1
––––––––––––––––––––––––––––––––––––––––––––––––––––––––––––––––––––––––