Singapore Airlines 2007 Annual Report Download - page 130
Download and view the complete annual report
Please find page 130 of the 2007 Singapore Airlines annual report below. You can navigate through the pages in the report by either clicking on the pages listed below, or by using the keyword search tool below to find specific information within the annual report.-
 1
1 -
2
-
3
-
4
-
5
-
6
-
7
-
8
-
9
-
10
-
11
-
12
-
13
-
14
-
15
-
16
-
17
-
18
-
19
-
20
-
21
-
22
-
23
-
24
-
25
-
26
-
27
-
28
-
29
-
30
-
31
-
32
-
33
-
34
-
35
-
36
-
37
-
38
-
39
-
40
-
41
-
42
-
43
-
44
-
45
-
46
-
47
-
48
-
49
-
50
-
51
-
52
-
53
-
54
-
55
-
56
-
57
-
58
-
59
-
60
-
61
-
62
-
63
-
64
-
65
-
66
-
67
-
68
-
69
-
70
-
71
-
72
-
73
-
74
-
75
-
76
-
77
-
78
-
79
-
80
-
81
-
82
-
83
-
84
-
85
-
86
-
87
-
88
-
89
-
90
-
91
-
92
-
93
-
94
-
95
-
96
-
97
-
98
-
99
-
100
-
101
-
102
-
103
-
104
-
105
-
106
-
107
-
108
-
109
-
110
-
111
-
112
-
113
-
114
-
115
-
116
-
117
-
118
-
119
-
 120
120 -
 121
121 -
 122
122 -
 123
123 -
 124
124 -
 125
125 -
 126
126 -
 127
127 -
 128
128 -
 129
129 -
 130
130 -
 131
131 -
 132
132 -
 133
133 -
 134
134 -
 135
135 -
 136
136 -
 137
137 -
 138
138 -
 139
139 -
 140
140 -
141
-
142
-
143
-
144
-
145
-
146
-
147
-
148
-
149
-
150
-
151
-
152
-
153
-
154
-
155
-
156
-
157
-
158
-
159
-
160
 |
 |

NOTES TO THE FINANCIAL STATEMENTS
31 March 2007
Singapore Airlines 128 Annual Report 2006-07
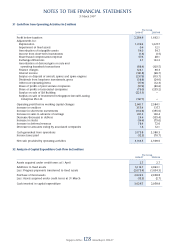
31 Cash Flow from Operating Activities (in $ million)
The Group
2006-07 2005-06
––––––––––––––––––––––––––––––––––––––––––––––––––––––––––––––––––––––––––––––––––––––––––––––––––––––––––––––––––––––––––––––––––––––––––––––––––––––––––––
Profi t before taxation 2,284.6 1,662.1
Adjustments for:
Depreciation 1,319.4 1,227.7
Impairment of fi xed assets 0.6 12.1
Amortisation of intangible assets 54.0 54.7
Income from short-term investments (1.6) (1.5)
Share-based compensation expense 57.6 48.1
Exchange differences 5.7 133.2
Amortisation of deferred gain on sale and
operating leaseback transactions (88.4) (103.5)
Finance charges 124.1 96.3
Interest income (181.8) (96.7)
Surplus on disposal of aircraft, spares and spare engines (237.9) (115.7)
Dividends from long-term investments, gross (38.8) (24.6)
Other non-operating items (77.9) (12.3)
Share of profi ts of joint venture companies (57.9) (40.6)
Share of profi ts of associated companies (79.0) (255.2)
Surplus on sale of SIA Building (223.3) –
Surplus on sale of investment in Singapore Aircraft Leasing
Enterprise Pte Ltd (197.7) –
––––––––––––––––––––––––––––––––––––
Operating profi t before working capital changes 2,661.7 2,584.1
Increase in creditors 355.4 137.7
Increase in short-term investments (130.8) (355.6)
Increase in sales in advance of carriage 201.3 160.4
Decrease/(Increase) in debtors 24.6 (155.4)
Increase in stocks (16.6) (75.0)
Increase in deferred revenue 78.4 72.0
Decrease in amounts owing by associated companies 1.8 12.1
––––––––––––––––––––––––––––––––––––
Cash generated from operations 3,175.8 2,380.3
Income taxes paid (12.3) (70.7)
––––––––––––––––––––––––––––––––––––
Net cash provided by operating activities 3,163.5 2,309.6
––––––––––––––––––––––––––––––––––––
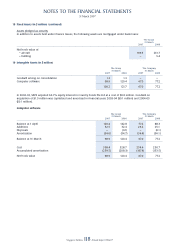
32 Analysis of Capital Expenditure Cash Flow (in $ million)
The Group
2006-07 2005-06
––––––––––––––––––––––––––––––––––––––––––––––––––––––––––––––––––––––––––––––––––––––––––––––––––––––––––––––––––––––––––––––––––––––––––––––––––––––––––––
Assets acquired under credit terms at 1 April 2.7 2.7
Additions to fi xed assets 5,114.7 3,093.1
Less: Progress payments transferred to fi xed assets (2,075.4) (1,034.3)
Purchase of fi xed assets 3,039.3 2,058.8
Less: Assets acquired under credit terms at 31 March (15.3) (2.7)
––––––––––––––––––––––––––––––––––––
Cash invested in capital expenditure 3,026.7 2,058.8
––––––––––––––––––––––––––––––––––––