Singapore Airlines 2007 Annual Report Download - page 126
Download and view the complete annual report
Please find page 126 of the 2007 Singapore Airlines annual report below. You can navigate through the pages in the report by either clicking on the pages listed below, or by using the keyword search tool below to find specific information within the annual report.-
 1
1 -
2
-
3
-
4
-
5
-
6
-
7
-
8
-
9
-
10
-
11
-
12
-
13
-
14
-
15
-
16
-
17
-
18
-
19
-
20
-
21
-
22
-
23
-
24
-
25
-
26
-
27
-
28
-
29
-
30
-
31
-
32
-
33
-
34
-
35
-
36
-
37
-
38
-
39
-
40
-
41
-
42
-
43
-
44
-
45
-
46
-
47
-
48
-
49
-
50
-
51
-
52
-
53
-
54
-
55
-
56
-
57
-
58
-
59
-
60
-
61
-
62
-
63
-
64
-
65
-
66
-
67
-
68
-
69
-
70
-
71
-
72
-
73
-
74
-
75
-
76
-
77
-
78
-
79
-
80
-
81
-
82
-
83
-
84
-
85
-
86
-
87
-
88
-
89
-
90
-
91
-
92
-
93
-
94
-
95
-
96
-
97
-
98
-
99
-
100
-
101
-
102
-
103
-
104
-
105
-
106
-
107
-
108
-
109
-
110
-
111
-
112
-
113
-
114
-
115
-
 116
116 -
 117
117 -
 118
118 -
 119
119 -
 120
120 -
 121
121 -
 122
122 -
 123
123 -
 124
124 -
 125
125 -
 126
126 -
 127
127 -
 128
128 -
 129
129 -
 130
130 -
 131
131 -
 132
132 -
 133
133 -
 134
134 -
 135
135 -
 136
136 -
137
-
138
-
139
-
140
-
141
-
142
-
143
-
144
-
145
-
146
-
147
-
148
-
149
-
150
-
151
-
152
-
153
-
154
-
155
-
156
-
157
-
158
-
159
-
160
 |
 |

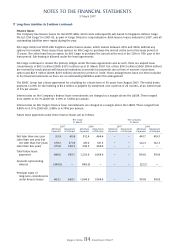
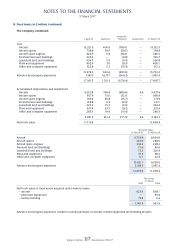
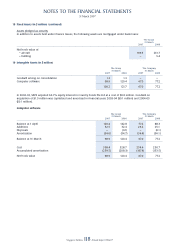
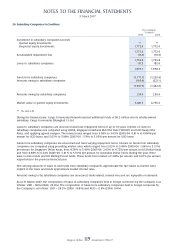
NOTES TO THE FINANCIAL STATEMENTS
31 March 2007
Singapore Airlines 124 Annual Report 2006-07
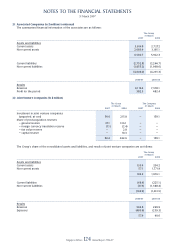
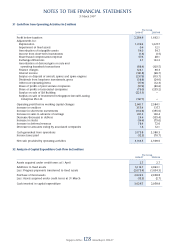
21 Associated Companies (in $ million) (continued)
The summarised fi nancial information of the associates are as follows:
The Group
31 March
2007 2006
–––––––––––––––––––––––––––––––––––––––––––––––––––––––––––––––––––––––––––––––––––––––––––––––––––––––––––––––––––––––––––––––––––––––––––––––––––––––––––––––––––––
Assets and liabilities
Current assets 3,816.8 2,727.2
Non-current assets 2,683.9 3,195.1
––––––––––––––––––––––––––––––––––––
6,500.7 5,922.3
––––––––––––––––––––––––––––––––––––
Current liabilities (2,752.8) (2,266.7)
Non-current liabilities (1,855.2) (1,968.6)
––––––––––––––––––––––––––––––––––––
(4,608.0) (4,235.3)
––––––––––––––––––––––––––––––––––––
2006-07 2005-06
–––––––––––––––––––––––––––––––––––––––––––––––––––––––––––––––––––––––––––––––––––––––––––––––––––––––––––––––––––––––––––––––––––––––––––––––––––––––––––––––––––––
Results
Revenue 9,116.4 7,578.1
Profi t for the period 382.3 482.4
22 Joint Venture Companies (in $ million)
The Group The Company
31 March 31 March
2007 2006 2007 2006
–––––––––––––––––––––––––––––––––––––––––––––––––––––––––––––––––––––––––––––––––––––––––––––––––––––––––––––––––––––––––––––––––––––––––––––––––––––––––––––––
Investment in joint venture companies
(unquoted, at cost) 56.6 215.8 – 159.1
Share of post-acquisition reserves
– general reserve 37.1 136.1 – –
– foreign currency translation reserve (7.1) (2.4) – –
– fair value reserve – 2.8 – –
– capital reserve – 10.3 – –
–––––––––––––––––––––––––––––––––––––––––––––––––––––––––––––––––––––––––
86.6 362.6 – 159.1
–––––––––––––––––––––––––––––––––––––––––––––––––––––––––––––––––––––––––
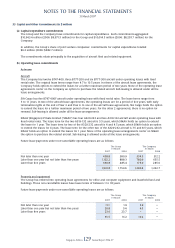
The Group’s share of the consolidated assets and liabilities, and results of joint venture companies are as follows:
The Group
31 March
2007 2006
–––––––––––––––––––––––––––––––––––––––––––––––––––––––––––––––––––––––––––––––––––––––––––––––––––––––––––––––––––––––––––––––––––––––––––––––––––––––––––––––––––––
Assets and liabilities
Current assets 135.4 204.2
Non-current assets 57.1 1,771.9
––––––––––––––––––––––––––––––––––––
192.5 1,976.1
––––––––––––––––––––––––––––––––––––
Current liabilities (68.6) (225.1)
Non-current liabilities (37.3) (1,388.4)
––––––––––––––––––––––––––––––––––––
(105.9) (1,613.5)
––––––––––––––––––––––––––––––––––––
2006-07 2005-06
–––––––––––––––––––––––––––––––––––––––––––––––––––––––––––––––––––––––––––––––––––––––––––––––––––––––––––––––––––––––––––––––––––––––––––––––––––––––––––––––––––––
Results
Revenue 543.8 299.9
Expenses (485.9) (259.3)
––––––––––––––––––––––––––––––––––––
57.9 40.6
––––––––––––––––––––––––––––––––––––