Singapore Airlines 2007 Annual Report Download - page 54
Download and view the complete annual report
Please find page 54 of the 2007 Singapore Airlines annual report below. You can navigate through the pages in the report by either clicking on the pages listed below, or by using the keyword search tool below to find specific information within the annual report.-
 1
1 -
2
-
3
-
4
-
5
-
6
-
7
-
8
-
9
-
10
-
11
-
12
-
13
-
14
-
15
-
16
-
17
-
18
-
19
-
20
-
21
-
22
-
23
-
24
-
25
-
26
-
27
-
28
-
29
-
30
-
31
-
32
-
33
-
34
-
35
-
36
-
37
-
38
-
39
-
40
-
41
-
42
-
43
-
 44
44 -
 45
45 -
 46
46 -
 47
47 -
 48
48 -
 49
49 -
 50
50 -
 51
51 -
 52
52 -
 53
53 -
 54
54 -
 55
55 -
 56
56 -
 57
57 -
 58
58 -
 59
59 -
 60
60 -
 61
61 -
 62
62 -
 63
63 -
 64
64 -
65
-
66
-
67
-
68
-
69
-
70
-
71
-
72
-
73
-
74
-
75
-
76
-
77
-
78
-
79
-
80
-
81
-
82
-
83
-
84
-
85
-
86
-
87
-
88
-
89
-
90
-
91
-
92
-
93
-
94
-
95
-
96
-
97
-
98
-
99
-
100
-
101
-
102
-
103
-
104
-
105
-
106
-
107
-
108
-
109
-
110
-
111
-
112
-
113
-
114
-
115
-
116
-
117
-
118
-
119
-
120
-
121
-
122
-
123
-
124
-
125
-
126
-
127
-
128
-
129
-
130
-
131
-
132
-
133
-
134
-
135
-
136
-
137
-
138
-
139
-
140
-
141
-
142
-
143
-
144
-
145
-
146
-
147
-
148
-
149
-
150
-
151
-
152
-
153
-
154
-
155
-
156
-
157
-
158
-
159
-
160
 |
 |
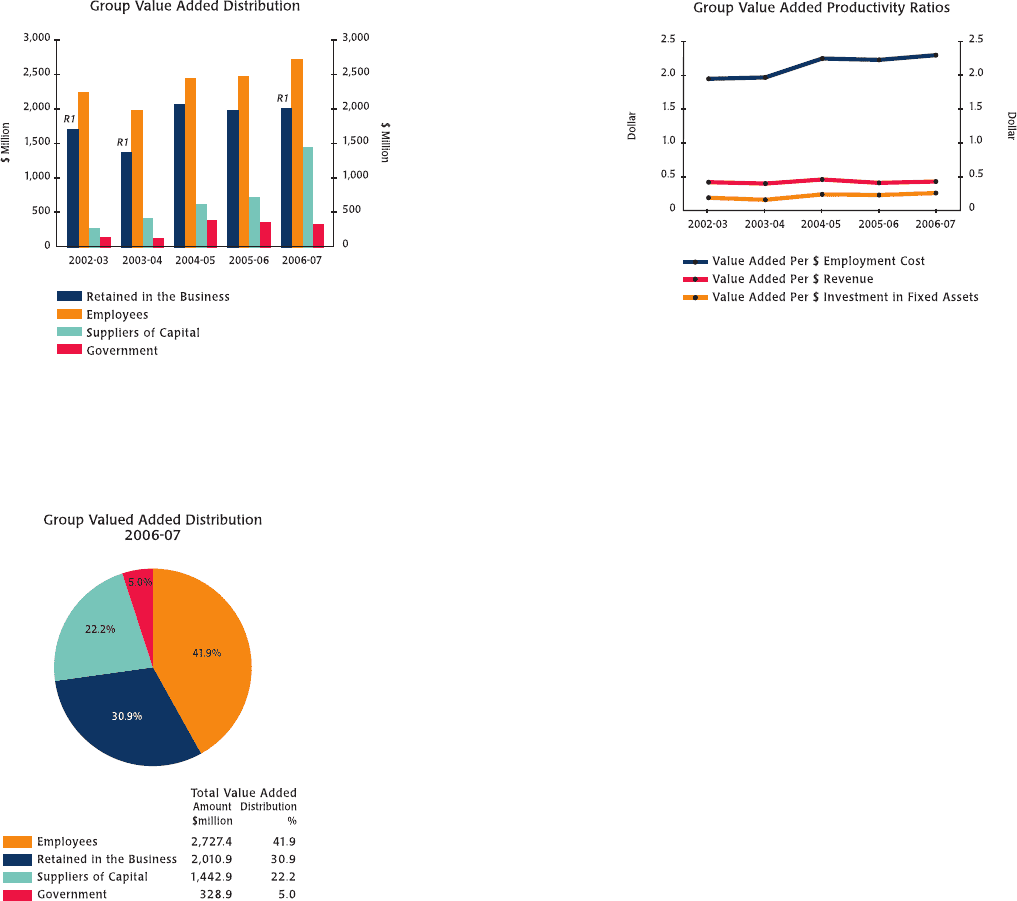
Singapore Airlines 52 Annual Report 2006-07
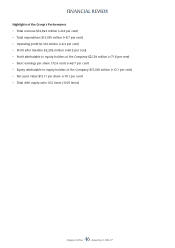
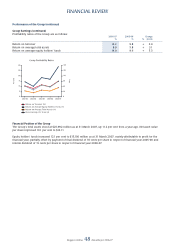
FINANCIAL REVIEW
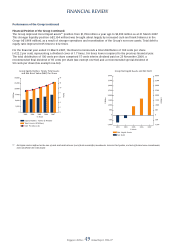
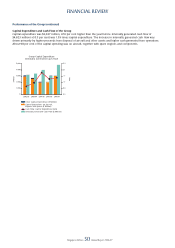
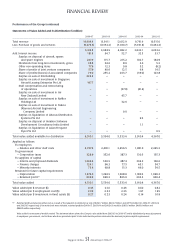
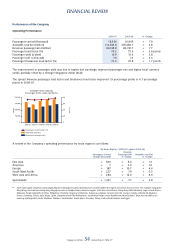
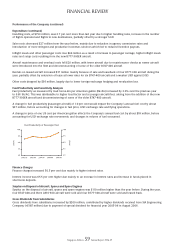
Performance of the Group (continued)
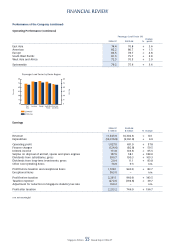
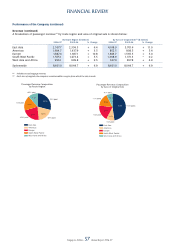
Value Added
Total value added for 2006-07 improved 17.6 per cent (+$976 million) to $6,510 million. The increase was mainly
attributable to higher revenue (+$1,153 million), surplus on sale of SIA Building and sale of investment in Singapore Aircraft
Leasing Enterprise (+$421 million) and higher surplus on disposal of aircraft, spares and spare engines (+$122 million),
partially offset by higher purchase of goods and services (-$726 million).
Salaries and other staff cost accounted for 41.9 per cent of the value added, 2.9 percentage points lower than
the previous year. $1,245 million (19.1 per cent) of the value added was for distribution to equity holders of the
Company (+9.1 percentage points) and $2,011 million (30.9 per cent) was retained for future capital requirements
(-5.0 percentage points).
R1 Excludes write-back of prior year’s tax liabilities of $246.7 million,
$204.7 million and $277.8 million for 2006-07, 2003-04 and 2002-03
respectively arising from reduction in statutory tax rate.