Singapore Airlines 2007 Annual Report Download - page 143
Download and view the complete annual report
Please find page 143 of the 2007 Singapore Airlines annual report below. You can navigate through the pages in the report by either clicking on the pages listed below, or by using the keyword search tool below to find specific information within the annual report.-
 1
1 -
2
-
3
-
4
-
5
-
6
-
7
-
8
-
9
-
10
-
11
-
12
-
13
-
14
-
15
-
16
-
17
-
18
-
19
-
20
-
21
-
22
-
23
-
24
-
25
-
26
-
27
-
28
-
29
-
30
-
31
-
32
-
33
-
34
-
35
-
36
-
37
-
38
-
39
-
40
-
41
-
42
-
43
-
44
-
45
-
46
-
47
-
48
-
49
-
50
-
51
-
52
-
53
-
54
-
55
-
56
-
57
-
58
-
59
-
60
-
61
-
62
-
63
-
64
-
65
-
66
-
67
-
68
-
69
-
70
-
71
-
72
-
73
-
74
-
75
-
76
-
77
-
78
-
79
-
80
-
81
-
82
-
83
-
84
-
85
-
86
-
87
-
88
-
89
-
90
-
91
-
92
-
93
-
94
-
95
-
96
-
97
-
98
-
99
-
100
-
101
-
102
-
103
-
104
-
105
-
106
-
107
-
108
-
109
-
110
-
111
-
112
-
113
-
114
-
115
-
116
-
117
-
118
-
119
-
120
-
121
-
122
-
123
-
124
-
125
-
126
-
127
-
128
-
129
-
130
-
131
-
132
-
 133
133 -
 134
134 -
 135
135 -
 136
136 -
 137
137 -
 138
138 -
 139
139 -
 140
140 -
 141
141 -
 142
142 -
 143
143 -
 144
144 -
 145
145 -
 146
146 -
 147
147 -
 148
148 -
 149
149 -
 150
150 -
 151
151 -
 152
152 -
 153
153 -
154
-
155
-
156
-
157
-
158
-
159
-
160
 |
 |

Singapore Airlines 141 Annual Report 2006-07
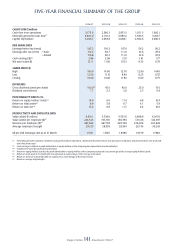
FIVE-YEAR FINANCIAL SUMMARY OF THE GROUP
2006-07 2005-06 2004-05 2003-04 2002-03
–––––––––––––––––––––––––––––––––––––––––––––––––––––––––––––––––––––––––––––––––––––––––––––––––––––––––––––––––––––––––––––––––––––––––––––––––––––––––––––––––––––––––––––––––––
CASH FLOW ($ million)
Cash fl ow from operations 3,175.8 2,380.3 2,853.3 1,811.3 1,892.1
Internally generated cash fl ow
R1
4,823.0 3,101.2 3,990.2 3,385.5 3,207.7
Capital expenditure 3,026.7 2,058.8 2,068.1 2,692.6 3,086.3
PER SHARE DATA
Earnings before tax (cents) 185.2 136.3 147.0 56.2 80.2
Earnings after tax (cents) – basic 172.6 101.7 111.0 61.6 87.4
– diluted 170.8 101.3 111.0 61.6 87.4
Cash earnings ($)
R2
2.84 2.08 2.10 1.61 1.77
Net asset value ($) 12.11 11.00 10.13 9.33 8.79
SHARE PRICE ($)
High 18.00 14.90 12.70 12.90 14.40
Low 12.00 11.10 9.40 8.25 8.55
Closing 16.60 14.00 11.90 11.00 8.75
DIVIDENDS
Gross dividends (cents per share) 100.0
R3
45.0 40.0 25.0 15.0
Dividend cover (times) 1.7 2.3 2.8 2.5 6.4
PROFITABILITY RATIOS (%)
Return on equity holders’ funds
R4
14.9 9.6 11.4 6.8 10.4
Return on total assets
R5
8.9 5.8 6.7 4.1 5.9
Return on turnover
R6
15.2 9.8 11.7 8.2 10.6
PRODUCTIVITY AND EMPLOYEE DATA
Value added ($ million) 6,510.1 5,534.0 5,533.6 3,898.9 4,367.0
Value added per employee ($)
R7
223,523 193,781 193,794 131,126 144,397
Revenue per employee ($)
R7
497,662 467,158 420,708 328,308 347,684
Average employee strength 29,125 28,558 28,554 29,734 30,243
S$ per US$ exchange rate as at 31 March 1.5171 1.6181 1.6496 1.6759 1.7640
–––––––––––––––––––––––––––––––––––––––––––––––––––––––––––––––––––––––––––––––––––––––––––––––––––––––––––––––––––––––––––––––––––––––––––––––––––––––––––––––––––––––––––––––––––
R1 Internally generated cash fl ow comprises cash generated from operations, dividends from joint venture and associated companies, and proceeds from sale of aircraft
and other fi xed assets.
R2 Cash earnings is defi ned as profi t attributable to equity holders of the Company plus depreciation and amortisation.
R3 Includes 50.0 cents per share special dividend.
R4 Return on equity holders’ funds is the profi t attributable to equity holders of the Company expressed as a percentage of the average equity holders’ funds.
R5 Return on total assets is the profi t after tax expressed as a percentage of the average total assets.
R6 Return on turnover is the profi t after tax expressed as a percentage of the total revenue.
R7 Based on average staff strength.