Singapore Airlines 2007 Annual Report Download - page 114
Download and view the complete annual report
Please find page 114 of the 2007 Singapore Airlines annual report below. You can navigate through the pages in the report by either clicking on the pages listed below, or by using the keyword search tool below to find specific information within the annual report.-
 1
1 -
2
-
3
-
4
-
5
-
6
-
7
-
8
-
9
-
10
-
11
-
12
-
13
-
14
-
15
-
16
-
17
-
18
-
19
-
20
-
21
-
22
-
23
-
24
-
25
-
26
-
27
-
28
-
29
-
30
-
31
-
32
-
33
-
34
-
35
-
36
-
37
-
38
-
39
-
40
-
41
-
42
-
43
-
44
-
45
-
46
-
47
-
48
-
49
-
50
-
51
-
52
-
53
-
54
-
55
-
56
-
57
-
58
-
59
-
60
-
61
-
62
-
63
-
64
-
65
-
66
-
67
-
68
-
69
-
70
-
71
-
72
-
73
-
74
-
75
-
76
-
77
-
78
-
79
-
80
-
81
-
82
-
83
-
84
-
85
-
86
-
87
-
88
-
89
-
90
-
91
-
92
-
93
-
94
-
95
-
96
-
97
-
98
-
99
-
100
-
101
-
102
-
103
-
 104
104 -
 105
105 -
 106
106 -
 107
107 -
 108
108 -
 109
109 -
 110
110 -
 111
111 -
 112
112 -
 113
113 -
 114
114 -
 115
115 -
 116
116 -
 117
117 -
 118
118 -
 119
119 -
 120
120 -
 121
121 -
 122
122 -
 123
123 -
 124
124 -
125
-
126
-
127
-
128
-
129
-
130
-
131
-
132
-
133
-
134
-
135
-
136
-
137
-
138
-
139
-
140
-
141
-
142
-
143
-
144
-
145
-
146
-
147
-
148
-
149
-
150
-
151
-
152
-
153
-
154
-
155
-
156
-
157
-
158
-
159
-
160
 |
 |

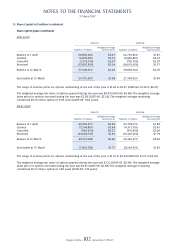
NOTES TO THE FINANCIAL STATEMENTS
31 March 2007
Singapore Airlines 112 Annual Report 2006-07
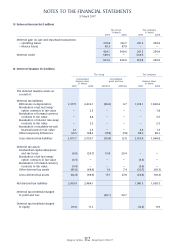
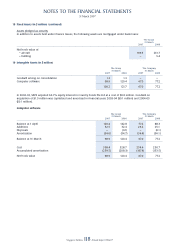
15 Deferred Account (in $ million)
The Group The Company
31 March 31 March
2007 2006 2007 2006
–––––––––––––––––––––––––––––––––––––––––––––––––––––––––––––––––––––––––––––––––––––––––––––––––––––––––––––––––––––––––––––––––––––––––––––––––––––––––––––––
Deferred gain on sale and leaseback transactions
– operating leases 374.8 301.7 261.3 254.9
– fi nance leases 49.3 47.9 – –
–––––––––––––––––––––––––––––––––––––––––––––––––––––––––––––––––––––––––
424.1 349.6 261.3 254.9
Deferred credit 549.5 – 549.5 –
–––––––––––––––––––––––––––––––––––––––––––––––––––––––––––––––––––––––––
973.6 349.6 810.8 254.9
–––––––––––––––––––––––––––––––––––––––––––––––––––––––––––––––––––––––––
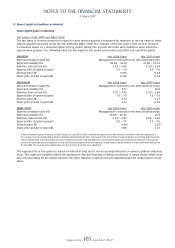
16 Deferred Taxation (in $ million)
The Group The Company
–––––––––––––––––––––––––––––––––––––––––––––––––––––––––––– ––––––––––––––––––––––––––––
Consolidated Consolidated
balance sheet profit and loss Balance sheet
31 March 31 March
2007 2006 2006-07 2005-06 2007 2006
–––––––––––––––––––––––––––––––––––––––––––––––––––––––––––––––––––––––––––––––––––––––––––––––––––––––––––––––––––––––––––––––––––––––––––––––––––––––––––––––
The deferred taxation arises as
a result of:
Deferred tax liabilities
Differences in depreciation 2,377.1 2,436.1 (59.0) 4.7 1,918.1 1,860.6
Revaluation of jet fuel swap/
option contracts to fair value – 2.3 – – – 1.8
Revaluation of forward currency
contracts to fair value – 4.4 – – – 3.5
Revaluation of interest rate swap
contracts to fair value – 2.3 – – – 2.3
Revaluation of available-for-sale
fi nancial assets to fair value 6.1 2.3 – – 4.8 1.3
Other temporary differences 90.5 108.3 (17.8) (7.8) 88.0 99.3
–––––––––––––––––––––––––––––––––––––––––––––––––––––––––––––––––––––––––––––––––––––––––––––––––––––––––––––
Gross deferred tax liabilities 2,473.7 2,555.7 (76.8) (3.1) 2,010.9 1,968.8
–––––––––––––––––––––––––––––––––––––––––––––––––––––––––––––––––––––––––––––––––––––––––––––––––––––––––––––
Deferred tax assets
Unabsorbed capital allowances
and tax losses (8.9) (24.7) 15.8 20.4 – –
Revaluation of jet fuel swap/
option contracts to fair value (6.5) – – – (5.3) –
Revaluation of forward currency
contracts to fair value (4.4) – – – (3.4) –
Other deferred tax assets (43.0) (44.9) 1.9 7.4 (20.7) (18.3)
–––––––––––––––––––––––––––––––––––––––––––––––––––––––––––––––––––––––––––––––––––––––––––––––––––––––––––––
Gross deferred tax assets (62.8) (69.6) 17.7 27.8 (29.4) (18.3)
–––––––––––––––––––––––––––––––––––––––––––––––––––––––––––––––––––––––––––––––––––––––––––––––––––––––––––––
Net deferred tax liabilities 2,410.9 2,486.1 1,981.5 1,950.5
–––––––––––––––––––––––––––––––––––––––––––––––––––––––––––––––––––––––––––––––––––––––––––––––––––––––––––––
Deferred tax (credited)/charged
to profi t and loss (59.1) 24.7
–––––––––––––––––––––––––––––––––––––––––––––––––––––––––––––––––––––––––––––––––––––––––––––––––––––––––––––
Deferred tax (credited)/charged
to equity (16.1) 11.3 (12.8) 8.9
–––––––––––––––––––––––––––––––––––––––––––––––––––––––––––––––––––––––––––––––––––––––––––––––––––––––––––––