Singapore Airlines 2007 Annual Report Download - page 144
Download and view the complete annual report
Please find page 144 of the 2007 Singapore Airlines annual report below. You can navigate through the pages in the report by either clicking on the pages listed below, or by using the keyword search tool below to find specific information within the annual report.-
 1
1 -
2
-
3
-
4
-
5
-
6
-
7
-
8
-
9
-
10
-
11
-
12
-
13
-
14
-
15
-
16
-
17
-
18
-
19
-
20
-
21
-
22
-
23
-
24
-
25
-
26
-
27
-
28
-
29
-
30
-
31
-
32
-
33
-
34
-
35
-
36
-
37
-
38
-
39
-
40
-
41
-
42
-
43
-
44
-
45
-
46
-
47
-
48
-
49
-
50
-
51
-
52
-
53
-
54
-
55
-
56
-
57
-
58
-
59
-
60
-
61
-
62
-
63
-
64
-
65
-
66
-
67
-
68
-
69
-
70
-
71
-
72
-
73
-
74
-
75
-
76
-
77
-
78
-
79
-
80
-
81
-
82
-
83
-
84
-
85
-
86
-
87
-
88
-
89
-
90
-
91
-
92
-
93
-
94
-
95
-
96
-
97
-
98
-
99
-
100
-
101
-
102
-
103
-
104
-
105
-
106
-
107
-
108
-
109
-
110
-
111
-
112
-
113
-
114
-
115
-
116
-
117
-
118
-
119
-
120
-
121
-
122
-
123
-
124
-
125
-
126
-
127
-
128
-
129
-
130
-
131
-
132
-
133
-
 134
134 -
 135
135 -
 136
136 -
 137
137 -
 138
138 -
 139
139 -
 140
140 -
 141
141 -
 142
142 -
 143
143 -
 144
144 -
 145
145 -
 146
146 -
 147
147 -
 148
148 -
 149
149 -
 150
150 -
 151
151 -
 152
152 -
 153
153 -
 154
154 -
155
-
156
-
157
-
158
-
159
-
160
 |
 |

Singapore Airlines 142 Annual Report 2006-07
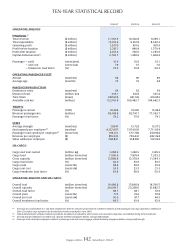
TEN-YEAR STATISTICAL RECORD
2006-07 2005-06 2004-05
––––––––––––––––––––––––––––––––––––––––––––––––––––––––––––––––––––––––––––––––––––––––––––––––––––––––––––––––––––––––––––––––––––––––––––––––––––––––––––––––––––––––––––––––––––––––––––––––––––––––––
SINGAPORE AIRLINES
FINANCIAL R1
Total revenue ($ million) 11,343.9 10,302.8 9,260.1
Total expenditure ($ million) 10,316.9 9,651.8 8,562.2
Operating profi t ($ million) 1,027.0 651.0 697.9
Profi t before taxation ($ million) 2,291.1 940.8 1,570.4
Profi t after taxation ($ million) 2,213.2 746.0 1,283.6
Capital disbursements R2 ($ million) 2,792.7 1,458.6 1,608.9
Passenger – yield (cents/pkm) 10.9 10.6 10.1
– unit cost (cents/ask) 7.9 7.5 7.0
– breakeven load factor (%) 72.5 70.8 69.3
OPERATING PASSENGER FLEET
Aircraft (numbers) 94 90 89
Average age (months) 75 76 64
PASSENGER PRODUCTION
Destination cities (numbers) 64 62 59
Distance fl own (million km) 353.1 341.8 325.4
Time fl own (hours) 458,936 441,510 419,925
Available seat-km (million) 112,543.8 109,483.7 104,662.3
TRAFFIC
Passengers carried (‘000) 18,346 16,995 15,944
Revenue passenger-km (million) 89,148.8 82,741.7 77,593.7
Passenger load factor (%) 79.2 75.6 74.1
STAFF
Average strength (numbers) 13,847 13,729 13,572
Seat capacity per employee R3 (seat-km) 8,127,667 7,974,630 7,711,634
Passenger load carried per employee R4 (tonne-km) 613,211 577,784 549,904
Revenue per employee ($) 819,232 750,441 682,294
Value added per employee ($) 368,831 258,810 301,024
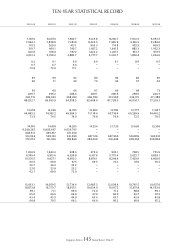
SIA CARGO
Cargo and mail carried (million kg) 1,284.9 1,248.5 1,149.5
Cargo load (million tonne-km) 7,995.6 7,874.4 7,333.2
Gross capacity (million tonne-km) 12,889.8 12,378.9 11,544.1
Cargo load factor (%) 62.0 63.6 63.5
Cargo yield (cents/ltk) 38.4 38.6 35.9
Cargo unit cost (cents/ctk) 24.5 23.5 21.3
Cargo breakeven load factor (%) 63.8 60.9 59.3
SINGAPORE AIRLINES AND SIA CARGO
Overall load (million tonne-km) 16,486.8 15,806.8 14,796.5
Overall capacity (million tonne-km) 24,009.7 23,208.0 21,882.5
Overall load factor (%) 68.7 68.1 67.6
Overall yield (cents/ltk) 77.5 74.6 70.8
Overall unit cost (cents/ctk) 50.0 47.7 44.5
Overall breakeven load factor (%) 64.5 63.9 62.9
––––––––––––––––––––––––––––––––––––––––––––––––––––––––––––––––––––––––––––––––––––––––––––––––––––––––––––––––––––––––––––––––––––––––––––––––––––––––––––––––––––––––––––––––––––––––––––––––––––––––––
R1 SIA Cargo was corporatised on 1 July 2001. Statistics for 2000-01 and prior years show the combined numbers of both passenger and cargo operations. Statistics for
2001-02 includes cargo operations for the fi rst three months only (April to June 2001).
R2 Capital disbursements comprised capital expenditure, investments in subsidiary, joint venture and associated companies, and additional long-term investments.
R3 Seat capacity per employee is available seat capacity divided by Singapore Airlines average staff strength.
R4 Passenger load carried per employee is defi ned as passenger load and excess baggage carried divided by Singapore Airlines average staff strength.