Singapore Airlines 2007 Annual Report Download - page 76
Download and view the complete annual report
Please find page 76 of the 2007 Singapore Airlines annual report below. You can navigate through the pages in the report by either clicking on the pages listed below, or by using the keyword search tool below to find specific information within the annual report.-
 1
1 -
2
-
3
-
4
-
5
-
6
-
7
-
8
-
9
-
10
-
11
-
12
-
13
-
14
-
15
-
16
-
17
-
18
-
19
-
20
-
21
-
22
-
23
-
24
-
25
-
26
-
27
-
28
-
29
-
30
-
31
-
32
-
33
-
34
-
35
-
36
-
37
-
38
-
39
-
40
-
41
-
42
-
43
-
44
-
45
-
46
-
47
-
48
-
49
-
50
-
51
-
52
-
53
-
54
-
55
-
56
-
57
-
58
-
59
-
60
-
61
-
62
-
63
-
64
-
65
-
 66
66 -
 67
67 -
 68
68 -
 69
69 -
 70
70 -
 71
71 -
 72
72 -
 73
73 -
 74
74 -
 75
75 -
 76
76 -
 77
77 -
 78
78 -
 79
79 -
 80
80 -
 81
81 -
 82
82 -
 83
83 -
 84
84 -
 85
85 -
 86
86 -
87
-
88
-
89
-
90
-
91
-
92
-
93
-
94
-
95
-
96
-
97
-
98
-
99
-
100
-
101
-
102
-
103
-
104
-
105
-
106
-
107
-
108
-
109
-
110
-
111
-
112
-
113
-
114
-
115
-
116
-
117
-
118
-
119
-
120
-
121
-
122
-
123
-
124
-
125
-
126
-
127
-
128
-
129
-
130
-
131
-
132
-
133
-
134
-
135
-
136
-
137
-
138
-
139
-
140
-
141
-
142
-
143
-
144
-
145
-
146
-
147
-
148
-
149
-
150
-
151
-
152
-
153
-
154
-
155
-
156
-
157
-
158
-
159
-
160
 |
 |

Singapore Airlines 74 Annual Report 2006-07
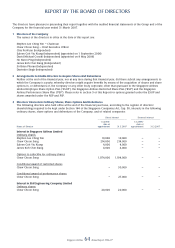
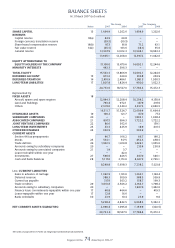
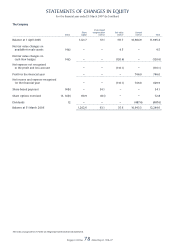
BALANCE SHEETS
At 31 March 2007 (in $ million)
The Group The Company
Notes 2007 2006 2007 2006
–––––––––––––––––––––––––––––––––––––––––––––––––––––––––––––––––––––––––––––––––––––––––––––––––––––––––––––––––––––––––––––––––––––––––––––––––––––––––––––––––––––––––––––––––––
SHARE CAPITAL 13 1,494.9 1,202.6 1,494.9 1,202.6
RESERVES
Capital reserve 14(a) 44.9 40.8 – –
Foreign currency translation reserve (59.5) (30.5) – –
Share-based compensation reserve 14(b) 97.3 81.8 71.2 63.1
Fair value reserve 14(c) (45.5) 163.6 (18.1) 35.6
General reserve 13,567.9 12,012.3 12,544.1 10,943.3
13,605.1 12,268.0 12,597.2 11,042.0
–––––––––––––––––––––––––––––––––––––––––––––––––––––––––––––––––––––––––
EQUITY ATTRIBUTABLE TO
EQUITY HOLDERS OF THE COMPANY 15,100.0 13,470.6 14,092.1 12,244.6
MINORITY INTERESTS 443.3 396.3 – –
–––––––––––––––––––––––––––––––––––––––––––––––––––––––––––––––––––––––––
TOTAL EQUITY 15,543.3 13,866.9 14,092.1 12,244.6
DEFERRED ACCOUNT 15 973.6 349.6 810.8 254.9
DEFERRED TAXATION 16 2,410.9 2,486.1 1,981.5 1,950.5
LONG-TERM LIABILITIES 17 1,805.8 1,824.4 900.0 1,022.3
–––––––––––––––––––––––––––––––––––––––––––––––––––––––––––––––––––––––––
20,733.6 18,527.0 17,784.4 15,472.3
–––––––––––––––––––––––––––––––––––––––––––––––––––––––––––––––––––––––––
Represented by:
FIXED ASSETS 18
Aircraft, spares and spare engines 12,944.3 12,208.4 10,204.2 9,150.9
Land and buildings 793.4 972.1 147.9 297.0
Others 2,574.0 2,344.2 2,257.3 2,046.5
16,311.7 15,524.7 12,609.4 11,494.4
INTANGIBLE ASSETS 19 100.2 121.7 67.0 77.2
SUBSIDIARY COMPANIES 20 – – 1,893.1 1,938.4
ASSOCIATED COMPANIES 21 897.5 996.3 1,722.2 1,722.2
JOINT VENTURE COMPANIES 22 86.6 362.6 – 159.1
LONG-TERM INVESTMENTS 23 43.3 425.9 18.9 401.5
OTHER RECEIVABLES 24 303.9 – 303.9 –
CURRENT ASSETS
Section 44 tax prepayments 46.7 166.2 46.7 166.2
Stocks 25 534.1 517.5 452.5 458.5
Trade debtors 26 1,952.5 1,610.8 1,429.1 1,055.0
Amounts owing by subsidiary companies 20 – – 215.4 230.9
Amounts owing by associated companies 21 1.9 3.7 – –
Loan-receivable within one year – 42.0 – –
Investments 27 596.0 446.5 467.0 346.1
Cash and bank balances 28 5,117.6 3,151.6 4,627.5 2,765.1
–––––––––––––––––––––––––––––––––––––––––––––––––––––––––––––––––––––––––
8,248.8 5,938.3 7,238.2 5,021.8
Less: CURRENT LIABILITIES
Sales in advance of carriage 1,392.9 1,191.6 1,365.1 1,164.4
Deferred revenue 388.3 309.9 388.3 309.9
Current tax payable 317.9 303.2 158.7 199.3
Trade creditors 29 3,061.8 2,546.2 2,164.7 1,798.2
Amounts owing to subsidiary companies 20 – – 1,967.6 1,442.0
Finance lease commitments-repayable within one year 17 60.8 464.6 – 419.5
Loans-repayable within one year 17 12.8 16.6 – –
Bank overdrafts 30 23.9 10.4 23.9 9.0
–––––––––––––––––––––––––––––––––––––––––––––––––––––––––––––––––––––––––
5,258.4 4,842.5 6,068.3 5,342.3
NET CURRENT ASSETS/(LIABILITIES) 2,990.4 1,095.8 1,169.9 (320.5)
–––––––––––––––––––––––––––––––––––––––––––––––––––––––––––––––––––––––––
20,733.6 18,527.0 17,784.4 15,472.3
–––––––––––––––––––––––––––––––––––––––––––––––––––––––––––––––––––––––––
The notes on pages 80 to 137 form an integral part of these fi nancial statements.