Singapore Airlines 2007 Annual Report Download - page 60
Download and view the complete annual report
Please find page 60 of the 2007 Singapore Airlines annual report below. You can navigate through the pages in the report by either clicking on the pages listed below, or by using the keyword search tool below to find specific information within the annual report.-
 1
1 -
2
-
3
-
4
-
5
-
6
-
7
-
8
-
9
-
10
-
11
-
12
-
13
-
14
-
15
-
16
-
17
-
18
-
19
-
20
-
21
-
22
-
23
-
24
-
25
-
26
-
27
-
28
-
29
-
30
-
31
-
32
-
33
-
34
-
35
-
36
-
37
-
38
-
39
-
40
-
41
-
42
-
43
-
44
-
45
-
46
-
47
-
48
-
49
-
 50
50 -
 51
51 -
 52
52 -
 53
53 -
 54
54 -
 55
55 -
 56
56 -
 57
57 -
 58
58 -
 59
59 -
 60
60 -
 61
61 -
 62
62 -
 63
63 -
 64
64 -
 65
65 -
 66
66 -
 67
67 -
 68
68 -
 69
69 -
 70
70 -
71
-
72
-
73
-
74
-
75
-
76
-
77
-
78
-
79
-
80
-
81
-
82
-
83
-
84
-
85
-
86
-
87
-
88
-
89
-
90
-
91
-
92
-
93
-
94
-
95
-
96
-
97
-
98
-
99
-
100
-
101
-
102
-
103
-
104
-
105
-
106
-
107
-
108
-
109
-
110
-
111
-
112
-
113
-
114
-
115
-
116
-
117
-
118
-
119
-
120
-
121
-
122
-
123
-
124
-
125
-
126
-
127
-
128
-
129
-
130
-
131
-
132
-
133
-
134
-
135
-
136
-
137
-
138
-
139
-
140
-
141
-
142
-
143
-
144
-
145
-
146
-
147
-
148
-
149
-
150
-
151
-
152
-
153
-
154
-
155
-
156
-
157
-
158
-
159
-
160
 |
 |

Singapore Airlines 58 Annual Report 2006-07
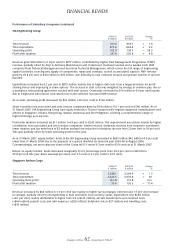
Performance of the Company (continued)
Expenditure
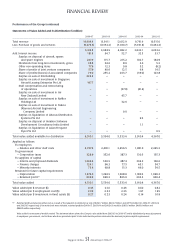
The Company’s expenditure for 2006-07 increased 6.9 per cent from a year ago, to $10,317 million as follows:
2006-07 2005-06 Change
$ million % $ million % $ million %
–––––––––––––––––––––––––––––––––––––––––––––––––––––––––––––––––––––––––––––––––––––––––––––––––––––––––––––––––––––––––––––––––––––––––––––––––––––––––––––––––––––––––––––––––––
Fuel cost 3,881.3 37.6 3,368.1 34.9 + 513.2 + 15.2
Staff costs 1,685.5 16.3 1,570.4 16.3 + 115.1 + 7.3
Depreciation R1 1,006.1 9.8 959.4 9.9 + 46.7 + 4.9
Handling charges 752.6 7.3 732.9 7.6 + 19.7 + 2.7
Sales costs R2 620.5 6.0 647.0 6.7 – 26.5 – 4.1
Infl ight meals and other passenger costs 601.8 5.8 556.3 5.8 + 45.5 + 8.2
Airport and overfl ying charges 515.4 5.0 520.4 5.4 – 5.0 – 1.0
Aircraft maintenance and overhaul costs 433.9 4.2 453.4 4.7 – 19.5 – 4.3
Rentals on leased aircraft 313.8 3.0 296.6 3.0 + 17.2 + 5.8
Communication and information
technology costs R3 110.1 1.1 115.0 1.2 – 4.9 – 4.3
Other costs R4 395.9 3.9 432.3 4.5 – 36.4 – 8.4
––––––––––––––––––––––––––––––––––––––––––––––––––––––––––––––––––––––––––––––––––––––––––––––––––––––
10,316.9 100.0 9,651.8 100.0 + 665.1 + 6.9
–––––––––––––––––––––––––––––––––––––––––––––––––––––––––––––––––––––––––––––––––––––––––––––––––––––––––––––––––––––––––––––––––––––––––––––––––––––––––––––––––––––––––––––––––––
R1 Depreciation included impairment of fi xed assets and amortisation of intangible assets (application software).
R2 Sales costs included commissions and incentives payable, frequent fl yer programme costs, computer reservation system booking fees, advertising expenses and other
sales costs.
R3 Communication and information technology costs were for data transmission and contract service fees, hire of computer equipment, maintenance/rental of software,
and information technology contract and professional fees.
R4 Other costs mainly comprised crew expenses, company accommodation costs, foreign exchange hedging and revaluation loss, comprehensive aviation insurance
costs, airport lounge expenses, non-information technology contract and professional fees, expenses incurred to mount non-scheduled services, aircraft licence fees
and recoveries.
A breakdown of fuel cost is shown below:
2006-07 2005-06 Change
$ million $ million $ million
–––––––––––––––––––––––––––––––––––––––––––––––––––––––––––––––––––––––––––––––––––––––––––––––––––––––––––––––––––––––––––––––––––––––––––––––––––––––––––––––––––––––––––––––––––
Fuel cost (before hedging) 3,787 3,535 + 252
Fuel hedging loss/(gain) 94 (167) + 261
––––––––––––––––––––––––––––––––––––––––––––––––––––––––––––––––––
Fuel cost (net) 3,881 3,368 + 513
–––––––––––––––––––––––––––––––––––––––––––––––––––––––––––––––––––––––––––––––––––––––––––––––––––––––––––––––––––––––––––––––––––––––––––––––––––––––––––––––––––––––––––––––––––
Expenditure on fuel was $513 million higher because of:
$ million
–––––––––––––––––––––––––––––––––––––––––––––––––––––––––––––––––––––––––––––––––––––––––––––––––––––––––––––––––––––––––––––––––––––––––––––––––––––––––––––––––––––––––––––––––––
10.7% increase in weighted average fuel price from 181.58 US¢/AG to 200.95 US¢/AG + 389
3.1% increase in volume uplifted from 1,172.15 M AG to 1,208.47 M AG + 109
5.5% weakening of USD against SGD from US$1=S$1.661 to US$1=S$1.570 – 246
–––––––––––––––––––––––
+ 252
Hedging loss of $94 million compared to hedging gain of $167 million in 2005-06 + 261
–––––––––––––––––––––––
+ 513
–––––––––––––––––––––––––––––––––––––––––––––––––––––––––––––––––––––––––––––––––––––––––––––––––––––––––––––––––––––––––––––––––––––––––––––––––––––––––––––––––––––––––––––––––––
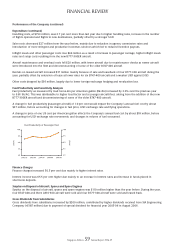
Staff costs rose $115 million mainly due to (i) higher provision for profi t-sharing bonus, (ii) higher allowances for crew
(such as meal and nightstop allowances), arising from an increase in capacity of 2.8 per cent (in terms of available seat
kilometres), and (iii) higher average staff strength (+118) this year.
Depreciation charges increased $47 million mainly due to (i) the commissioning of nine B777-300ER aircraft during the
year and (ii) capitalisation of expenditure for heavy maintenance visits on aircraft and engine overhauls. The increase was
partially offset by (i) full year’s impact of sale of one B747-400 aircraft and two A310-300 aircraft, and trade in of one
B747-400 and two A310-300 aircraft last year; (ii) sale of four B747-400 and three A310-300 aircraft, and sale and leaseback
of four B777-300 aircraft during the year.
FINANCIAL REVIEW