Western Union 2006 Annual Report Download - page 99
Download and view the complete annual report
Please find page 99 of the 2006 Western Union annual report below. You can navigate through the pages in the report by either clicking on the pages listed below, or by using the keyword search tool below to find specific information within the annual report.-
 1
1 -
2
-
3
-
4
-
5
-
6
-
7
-
8
-
9
-
10
-
11
-
12
-
13
-
14
-
15
-
16
-
17
-
18
-
19
-
20
-
21
-
22
-
23
-
24
-
25
-
26
-
27
-
28
-
29
-
30
-
31
-
32
-
33
-
34
-
35
-
36
-
37
-
38
-
39
-
40
-
41
-
42
-
43
-
44
-
45
-
46
-
47
-
48
-
49
-
50
-
51
-
52
-
53
-
54
-
55
-
56
-
57
-
58
-
59
-
60
-
61
-
62
-
63
-
64
-
65
-
66
-
67
-
68
-
69
-
70
-
71
-
72
-
73
-
74
-
75
-
76
-
77
-
78
-
79
-
80
-
81
-
82
-
83
-
84
-
85
-
86
-
87
-
88
-
 89
89 -
 90
90 -
 91
91 -
 92
92 -
 93
93 -
 94
94 -
 95
95 -
 96
96 -
 97
97 -
 98
98 -
 99
99 -
 100
100 -
 101
101 -
 102
102 -
 103
103 -
 104
104
 |
 |

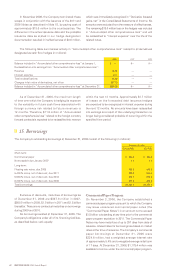
Notes to Consolidated Financial Statements 97
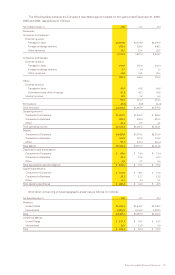
The following table presents the Company’s reportable segment results for the years ended December 31, 2006,
2005 and 2004, respectively (in millions):
Years Ended December 31, 2006 2005 2004
Revenues:
Consumer-to-Consumer:
External revenue
Transaction fees $3,059.0 $2,724.0 $2,390.9
Foreign exchange revenue 652.4 529.6 448.3
Other revenues 33.5 25.6 22.5
3,744.9 3,279.2 2,861.7
Consumer-to-Business:
External revenue
Transaction fees 593.7 565.0 545.4
Foreign exchange revenue 1.5 1.4 1.3
Other revenues 41.0 33.8 29.6
636.2 600.2 576.3
Other:
External revenue
Transaction fees 43.9 65.8 69.8
Commission and other revenues 45.2 42.7 39.8
Internal revenue 0.9 5.2 6.0
90.0 113.7 115.6
Eliminations (0.9) (5.2) (6.0)
Total revenues $4,470.2 $3,987.9 $3,547.6
Operating income:
Consumer-to-Consumer $1,069.7 $1,047.9 $ 886.5
Consumer-to-Business 223.3 220.4 219.5
Other 18.4 0.9 6.1
Total operating income $1,311.4 $1,269.2 $1,112.1
Assets:
Consumer-to-Consumer $4,458.0 $3,759.3 $2,533.6
Consumer-to-Business 765.8 587.0 565.8
Other 97.3 245.4 216.4
Total assets $5,321.1 $4,591.7 $3,315.8
Depreciation and amortization:
Consumer-to-Consumer $ 80.6 $ 54.0 $ 51.4
Consumer-to-Business 18.1 19.8 21.2
Other 4.8 5.7 6.6
Total depreciation and amortization $ 103.5 $ 79.5 $ 79.2
Capital expenditures:
Consumer-to-Consumer $ 174.8 $ 48.3 $ 31.6
Consumer-to-Business 21.1 12.7 12.8
Other 6.4 4.0 5.1
Total capital expenditures $ 202.3 $ 65.0 $ 49.5
Information concerning principal geographic areas was as follows (in millions):
Year Ended December 31, 2006 2005 2004
Revenue:
United States $1,889.3 $1,842.7 $1,708.3
International 2,580.9 2,145.2 1,839.3
Total $4,470.2 $3,987.9 $3,547.6
Long-lived assets:
United States $ 157.3 $ 70.5 $ 61.7
International 18.8 11.9 9.0
Total $ 176.1 $ 82.4 $ 70.7