Western Union 2006 Annual Report Download - page 69
Download and view the complete annual report
Please find page 69 of the 2006 Western Union annual report below. You can navigate through the pages in the report by either clicking on the pages listed below, or by using the keyword search tool below to find specific information within the annual report.-
 1
1 -
2
-
3
-
4
-
5
-
6
-
7
-
8
-
9
-
10
-
11
-
12
-
13
-
14
-
15
-
16
-
17
-
18
-
19
-
20
-
21
-
22
-
23
-
24
-
25
-
26
-
27
-
28
-
29
-
30
-
31
-
32
-
33
-
34
-
35
-
36
-
37
-
38
-
39
-
40
-
41
-
42
-
43
-
44
-
45
-
46
-
47
-
48
-
49
-
50
-
51
-
52
-
53
-
54
-
55
-
56
-
57
-
58
-
 59
59 -
 60
60 -
 61
61 -
 62
62 -
 63
63 -
 64
64 -
 65
65 -
 66
66 -
 67
67 -
 68
68 -
 69
69 -
 70
70 -
 71
71 -
 72
72 -
 73
73 -
 74
74 -
 75
75 -
 76
76 -
 77
77 -
 78
78 -
 79
79 -
80
-
81
-
82
-
83
-
84
-
85
-
86
-
87
-
88
-
89
-
90
-
91
-
92
-
93
-
94
-
95
-
96
-
97
-
98
-
99
-
100
-
101
-
102
-
103
-
104
 |
 |

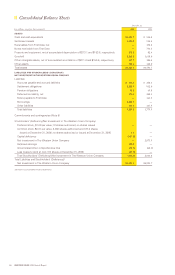
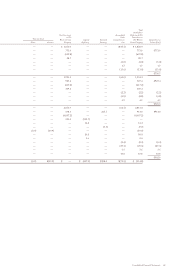
67
Total
Stockholders’
Net Investment Accumulated (Deficiency)/Net
in The Other Investment in
Western Union Capital Retained Comprehensive The Western Comprehensive
Shares Amount Company Deficiency Earnings Loss Union Company Income (Loss)
— — $ 1,874.0 — — $(45.1) $ 1,828.9
— — 751.6 — — — 751.6 $751.6
— — (659.8) — — — (659.8)
— — 28.7 — — — 28.7
— — — — — (3.0) (3.0) (3.0)
— — — — — 1.7 1.7 1.7
— — — — — (13.6) (13.6) (13.6)
$736.7
— — 1,994.5 — — (60.0) 1,934.5
— — 927.4 — — — 927.4 $927.4
— — (417.2) — — — (417.2)
— — 369.2 — — — 369.2
— — — — — (2.2) (2.2) (2.2)
— — — — — (4.8) (4.8) (4.8)
— — — — — 4.9 4.9 4.9
$925.3
— — 2,873.9 — — (62.1) 2,811.8
— — 698.3 — 215.7 — 914.0 $914.0
— — (4,097.2) — — — (4,097.2)
— — 525.0 (532.7) — — —
— — — 14.2 — — 14.2
— — — — (7.7) — (7.7)
(0.9) (19.9) — — — — (19.9)
— — — 80.8 — — 80.8
— — — 0.6 — — 0.6
— — — — — (0.4) (0.4) (0.4)
— — — — — (29.3) (29.3) (29.3)
— — — — — 7.5 7.5 7.5
— — — — — 10.8 10.8 10.8
$902.6
(0.9) $(19.9) $ — $ (437.1) $208.0 $(73.5) $ (314.8)
Treasury Stock
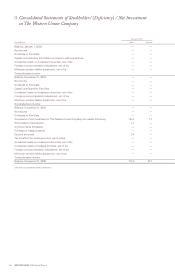
Consolidated Financial Statements