Western Union 2006 Annual Report Download - page 35
Download and view the complete annual report
Please find page 35 of the 2006 Western Union annual report below. You can navigate through the pages in the report by either clicking on the pages listed below, or by using the keyword search tool below to find specific information within the annual report.-
 1
1 -
2
-
3
-
4
-
5
-
6
-
7
-
8
-
9
-
10
-
11
-
12
-
13
-
14
-
15
-
16
-
17
-
18
-
19
-
20
-
21
-
22
-
23
-
24
-
 25
25 -
 26
26 -
 27
27 -
 28
28 -
 29
29 -
 30
30 -
 31
31 -
 32
32 -
 33
33 -
 34
34 -
 35
35 -
 36
36 -
 37
37 -
 38
38 -
 39
39 -
 40
40 -
 41
41 -
 42
42 -
 43
43 -
 44
44 -
 45
45 -
46
-
47
-
48
-
49
-
50
-
51
-
52
-
53
-
54
-
55
-
56
-
57
-
58
-
59
-
60
-
61
-
62
-
63
-
64
-
65
-
66
-
67
-
68
-
69
-
70
-
71
-
72
-
73
-
74
-
75
-
76
-
77
-
78
-
79
-
80
-
81
-
82
-
83
-
84
-
85
-
86
-
87
-
88
-
89
-
90
-
91
-
92
-
93
-
94
-
95
-
96
-
97
-
98
-
99
-
100
-
101
-
102
-
103
-
104
 |
 |

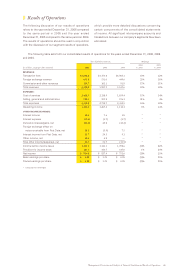
33 Selected Financial Data
Year Ended December 31, 2006 2005 2004 2003 2002
(in millions, except per share data) (unaudited )
STATEMENTS OF INCOME DATA:
Revenues $4,470.2 $3,987.9 $3,547.6 $3,151.6 $2,743.4
Operating expenses
(a)
(b) 3,158.8 2,718.7 2,435.5 2,148.6 1,919.9
Operating income 1,311.4 1,269.2 1,112.1 1,003.0 823.5
Other income/(expense), net
(c) 23.7 74.9 (13.5) (40.4) (24.2)
Income before income taxes
(a)
(b)
(c) 1,335.1 1,344.1 1,098.6 962.6 799.3
Net income
(a)
(b)
(c) 914.0 927.4 751.6 633.7 494.1
Depreciation and amortization 103.5 79.5 79.2 78.4 60.2
CASH FLOW DATA:
Net cash provided by operating activities 1,108.9 1,002.8 930.2 792.8 607.5
Dividends to First Data 2,953.9 417.2 659.8 324.2 486.8
EARNINGS PER SHARE DATA:
Basic
(a)
(b)
(c)
(d) $ 1.20 $ 1.21 $0.98 $ 0.83 $ 0.65
Diluted
(a)
(b)
(c)
(d) $ 1.19 $ 1.21 $0.98 $ 0.83 $ 0.65
Cash dividends to public stockholders
per common share $ 0.01 — — — —
KEY INDICATORS (UNAUDITED):
Consumer-to-consumer transactions
(e) 147.08 118.52 96.66 81.04 67.84
Consumer-to-business transactions
(f) 249.38 215.11 192.57 179.39 145.01
Year ended December 31, 2006 2005 2004 2003 2002
(unaudited ) (unaudited )
BALANCE SHEET DATA:
Settlement assets $1,284.2 $ 914.4 $ 702.5 $ 583.9 $ 473.2
Total assets 5,321.1 4,591.7 3,315.8 3,027.4 2,469.7
Settlement obligations 1,282.5 912.0 696.6 573.6 460.6
Total borrowings 3,323.5 — — — —
Total liabilities 5,635.9 1,779.9 1,381.3 1,198.5 999.0
Total stockholders’ (deficiency)/net
investment in The Western Union Company (314.8) 2,811.8 1,934.5 1,828.9 1,470.7
(a) We adopted SFAS No. 123R, “Share-Based Payment,” or “SFAS No. 123R,” following the modified prospective method effective January 1, 2006. SFAS No. 123R requires all
stock-based payments to employees to be recognized in the income statement based on their respective grant date fair values over the corresponding service periods and also
requires an estimation of forfeitures when calculating compensation expense. Stock-based compensation expense, including stock compensation expense allocated by First Data
prior to the spin-off on September 29, 2006 and the impact of adopting SFAS No. 123R, was $30.1 million for the year ended December 31, 2006.
(b) In 2002, our company recorded expenses of $41.0 million related to the settlement of certain class action litigation and regulatory matters.
(c) Primarily includes interest income on international cash balances and a loan made to one of our agents, interest expense on debt incurred in connection with the spin-off, derivative
gains and losses, the net foreign exchange effect on notes receivable from First Data and related foreign currency swaps with First Data, and net interest income due from First Data.
Prior to September 29, 2006, we did not have any forward contracts that qualified as hedges, and therefore, the gains and losses on these contracts were reflected in income prior
to that date. On September 29, 2006, we re-established our foreign currency forward positions to qualify for cash flow hedge accounting. As a result, after September 29, 2006,
we anticipate the amounts reflected in the caption “Derivative (losses)/gains, net” will be minimal. The notes receivable from First Data affiliates and related foreign currency swap
agreements were settled in cash in connection with the spin-off. Accordingly, we will no longer have any amounts related to the revaluation of notes receivable from First Data and
the related foreign currency swap arrangements recognized on the statement of income in the caption “Foreign exchange effect on notes receivable from First Data, net.” During
years ended December 31, 2006, 2005, 2004, 2003 and 2002, the pre-tax derivative (loss)/gain was $(21.2) million, $45.8 million, $(30.2) million, $(37.9) million and $(28.9) million,
respectively. During the years ended December 31, 2006, 2005 and 2004, the pre-tax gain/(loss) on foreign exchange translation of notes receivable from First Data and valuation
of related foreign currency swap agreements was $10.1 million, $(5.9) million, and $7.5 million, respectively. There were no gains or losses during 2003 or 2002.
(d) For all periods prior to September 29, 2006 (the date of our spin-off from First Data), basic and diluted earnings per share were computed utilizing the basic shares outstanding at
September 29, 2006.
(e) Consumer-to-consumer transactions include consumer-to-consumer money transfer services worldwide. Amounts include Vigo Remittance Corp. transactions since the acquisition
date of October 21, 2005.
(f) Consumer-to-business transactions include Quick Collect, Western Union Convenience Pay, Speedpay, Equity Accelerator, and Pago Fácil transactions processed by us. Amounts
include SEPSA (Pago Fácil) transactions since its acquisition in December 2006, E Commerce Group, Inc. (Speedpay) transactions since its acquisition in June 2002 and Paymap Inc.
(Equity Accelerator®) transactions since its acquisition in April 2002.
Our selected historical financial data are not necessarily
indicative of our future financial position, future results of
operations or future cash flows.
You should read the information set forth below in
conjunction with Management’s Discussion and Analysis
of Financial Condition and Results of Operations and
our historical consolidated financial statements and the
notes to those statements included elsewhere in this
Annual Report.