Western Union 2006 Annual Report Download - page 45
Download and view the complete annual report
Please find page 45 of the 2006 Western Union annual report below. You can navigate through the pages in the report by either clicking on the pages listed below, or by using the keyword search tool below to find specific information within the annual report.-
 1
1 -
2
-
3
-
4
-
5
-
6
-
7
-
8
-
9
-
10
-
11
-
12
-
13
-
14
-
15
-
16
-
17
-
18
-
19
-
20
-
21
-
22
-
23
-
24
-
25
-
26
-
27
-
28
-
29
-
30
-
31
-
32
-
33
-
34
-
 35
35 -
 36
36 -
 37
37 -
 38
38 -
 39
39 -
 40
40 -
 41
41 -
 42
42 -
 43
43 -
 44
44 -
 45
45 -
 46
46 -
 47
47 -
 48
48 -
 49
49 -
 50
50 -
 51
51 -
 52
52 -
 53
53 -
 54
54 -
 55
55 -
56
-
57
-
58
-
59
-
60
-
61
-
62
-
63
-
64
-
65
-
66
-
67
-
68
-
69
-
70
-
71
-
72
-
73
-
74
-
75
-
76
-
77
-
78
-
79
-
80
-
81
-
82
-
83
-
84
-
85
-
86
-
87
-
88
-
89
-
90
-
91
-
92
-
93
-
94
-
95
-
96
-
97
-
98
-
99
-
100
-
101
-
102
-
103
-
104
 |
 |

Management’s Discussion and Analysis of Financial Condition and Results of Operations 43
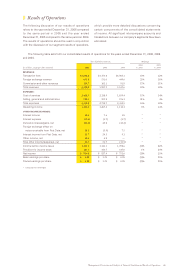
|| Results of Operations
The following discussion of our results of operations
refers to the year ended December 31, 2006 compared
to the same period in 2005 and the year ended
December 31, 2005 compared to the same period in 2004.
The results of operations should be read in conjunction
with the discussion of our segment results of operations,
which provide more detailed discussions concerning
certain components of the consolidated statements
of income. All significant intercompany accounts and
transactions between our company’s segments have been
eliminated.
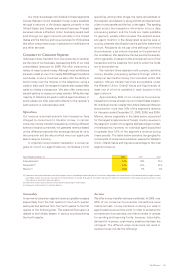
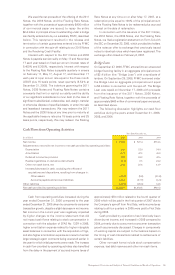
The following table sets forth our consolidated results of operations for the years ended December 31, 2006, 2005
and 2004.
Years Ended December 31, % Change
2006 2005
(in millions, except per share amounts) 2006 2005 2004 vs. 2005 vs. 2004
REVENUES:
Transaction fees $3,696.6 $3,354.8 $3,006.1 10% 12%
Foreign exchange revenue 653.9 531.0 449.6 23% 18%
Commission and other revenues 119.7 102.1 91.9 17% 11%
Total revenues 4,470.2 3,987.9 3,547.6 12% 12%
EXPENSES:
Cost of services 2,430.5 2,118.9 1,859.4 15% 14%
Selling, general and administrative 728.3 599.8 576.1 21% 4%
Total expenses 3,158.8 2,718.7 2,435.5 16% 12%
Operating income 1,311.4 1,269.2 1,112.1 3% 14%
OTHER INCOME/(EXPENSE):
Interest income 40.1 7.6 1.8 * *
Interest expense (53.4) (1.7) (1.7) * *
Derivative (losses)/gains, net (21.2) 45.8 (30.2) * *
Foreign exchange effect on
notes receivable from First Data, net 10.1 (5.9) 7.5 * *
Interest income from First Data, net 35.7 24.3 9.1 * *
Other income, net 12.4 4.8 — * *
Total other income/(expense), net 23.7 74.9 (13.5) * *
Income before income taxes 1,335.1 1,344.1 1,098.6 (1)% 22%
Provision for income taxes 421.1 416.7 347.0 1% 20%
Net income $ 914.0 $ 927.4 $ 751.6 (1)% 23%
Basic earnings per share $ 1.20 $ 1.21 $ 0.98 (1)% 23%
Diluted earnings per share $ 1.19 $ 1.21 $ 0.98 (2)% 23%
* Calculation not meaningful