Western Union 2006 Annual Report Download - page 82
Download and view the complete annual report
Please find page 82 of the 2006 Western Union annual report below. You can navigate through the pages in the report by either clicking on the pages listed below, or by using the keyword search tool below to find specific information within the annual report.-
 1
1 -
2
-
3
-
4
-
5
-
6
-
7
-
8
-
9
-
10
-
11
-
12
-
13
-
14
-
15
-
16
-
17
-
18
-
19
-
20
-
21
-
22
-
23
-
24
-
25
-
26
-
27
-
28
-
29
-
30
-
31
-
32
-
33
-
34
-
35
-
36
-
37
-
38
-
39
-
40
-
41
-
42
-
43
-
44
-
45
-
46
-
47
-
48
-
49
-
50
-
51
-
52
-
53
-
54
-
55
-
56
-
57
-
58
-
59
-
60
-
61
-
62
-
63
-
64
-
65
-
66
-
67
-
68
-
69
-
70
-
71
-
 72
72 -
 73
73 -
 74
74 -
 75
75 -
 76
76 -
 77
77 -
 78
78 -
 79
79 -
 80
80 -
 81
81 -
 82
82 -
 83
83 -
 84
84 -
 85
85 -
 86
86 -
 87
87 -
 88
88 -
 89
89 -
 90
90 -
 91
91 -
 92
92 -
93
-
94
-
95
-
96
-
97
-
98
-
99
-
100
-
101
-
102
-
103
-
104
 |
 |
WESTERN UNION 2006 Annual Report 80
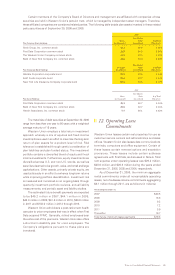
Amounts advanced to agents
From time to time, we make advances and loans to agents.
In 2006, we signed a six year agreement with one of
our existing agents which included a four year loan of
$140.0 million to the agent, of which $20.0 million was
repaid by the agent during 2006. The terms of the loan
agreement require that a percentage of commissions
earned by the agent (52% in 2007, 61% in 2008 and
64% in 2009) be withheld by us as repayment of the
loan and the agent remains obligated to repay the loan if
commissions earned are not sufficient. We impute interest
on this below-market rate note receivable and recorded it
net of an original discount of $52.7 million. Such discount
was $37.8 million as of December 31, 2006.
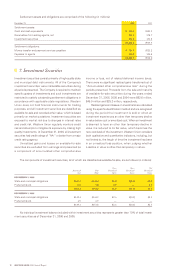
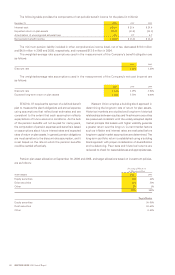
|| 8. Property and Equipment
Property and equipment consists of the following (in millions):
December 31, 2006 2005
Equipment $ 245.8 $ 222.0
Leasehold improvements 32.4 27.1
Furniture and fixtures 23.9 16.6
Land and improvements 12.9 —
Buildings 71.5 —
Projects in process 2.7 0.3
389.2 266.0
Less accumulated depreciation (213.1) (183.6)
Property and equipment, net $ 176.1 $ 82.4
Amounts charged to expense for depreciation of property and equipment were $34.8 million, $32.0 million, and
$34.0 million during the years ended December 31, 2006, 2005 and 2004, respectively.
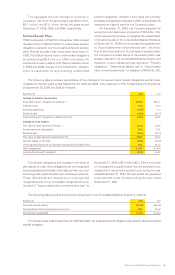
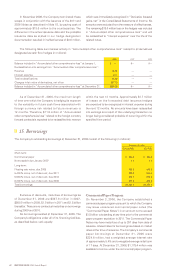
|| 9. Other Assets and
Other Liabilities
The following table summarizes the components of other assets and other liabilities (in millions):
December 31, 2006 2005
OTHER ASSETS:
Equity method investments $165.1 $150.2
Amounts advanced to agents, net of discounts 112.4 46.0
Deferred customer set up costs 45.5 46.2
Prepaid commissions 37.8 —
Accounts receivable, net 24.3 24.8
Receivable from First Data for stock option proceeds 17.8 —
Prepaid expenses 16.6 9.0
Debt issue costs 14.6 —
Derivative financial instruments 0.6 19.4
Other 68.7 46.4
Total other assets $503.4 $342.0
OTHER LIABILITIES:
Deferred revenue $ 83.3 $ 87.1
Derivative financial instruments 12.8 1.1
Due to minority interest holder — 23.8
Other 51.3 35.9
Total other liabilities $147.4 $147.9