Western Union 2006 Annual Report Download - page 100
Download and view the complete annual report
Please find page 100 of the 2006 Western Union annual report below. You can navigate through the pages in the report by either clicking on the pages listed below, or by using the keyword search tool below to find specific information within the annual report.-
 1
1 -
2
-
3
-
4
-
5
-
6
-
7
-
8
-
9
-
10
-
11
-
12
-
13
-
14
-
15
-
16
-
17
-
18
-
19
-
20
-
21
-
22
-
23
-
24
-
25
-
26
-
27
-
28
-
29
-
30
-
31
-
32
-
33
-
34
-
35
-
36
-
37
-
38
-
39
-
40
-
41
-
42
-
43
-
44
-
45
-
46
-
47
-
48
-
49
-
50
-
51
-
52
-
53
-
54
-
55
-
56
-
57
-
58
-
59
-
60
-
61
-
62
-
63
-
64
-
65
-
66
-
67
-
68
-
69
-
70
-
71
-
72
-
73
-
74
-
75
-
76
-
77
-
78
-
79
-
80
-
81
-
82
-
83
-
84
-
85
-
86
-
87
-
88
-
89
-
 90
90 -
 91
91 -
 92
92 -
 93
93 -
 94
94 -
 95
95 -
 96
96 -
 97
97 -
 98
98 -
 99
99 -
 100
100 -
 101
101 -
 102
102 -
 103
103 -
 104
104
 |
 |

WESTERN UNION 2006 Annual Report 98
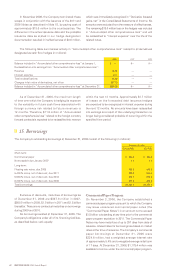
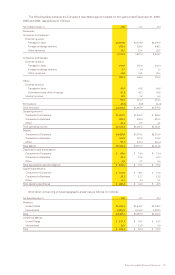
The geographic split of revenue above has been
determined based upon the country where a money transfer
is initiated and the country where a money transfer is paid
with revenue being split 50% between the two countries.
Long-lived assets, consisting of “Property and equipment,
net,” are presented based upon the location of the assets.
A majority of Western Union’s consumer-to-consumer
transactions involve at least one non-United States location.
Based on the method used to attribute revenue between
countries described in the paragraph above, no individual
country outside the United States accounted for more
than 10% of segment revenue for the year ended
December 31, 2006, 2005 and 2004. In addition, no
individual agent or biller accounted for greater than 10%
of consumer-to-consumer or consumer-to-business
segment revenue, respectively, during these periods.
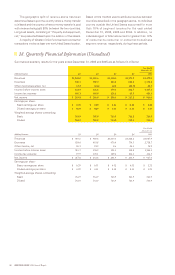
|| 18. Quarterly Financial Information (Unaudited)
Summarized quarterly results for the years ended December 31, 2006 and 2005 are as follows (in millions):
Year Ended
December 31,
2006 by Quarter: Q1 Q2 Q3 Q4 2006
Revenues $1,043.0 $1,113.6 $1,140.4 $1,173.2 $4,470.2
Expenses 730.3 787.2 803.3 838.0 3,158.8
Other income/(expense), net 12.2 (2.6) 42.8 (28.7) 23.7
Income before income taxes 324.9 323.8 379.9 306.5 1,335.1
Income tax expense 105.1 104.9 121.8 89.3 421.1
Net income $ 219.8 $ 218.9 $ 258.1 $ 217.2 $ 914.0
Earnings per share:
Basic earnings per share $ 0.29 $ 0.29 $ 0.34 $ 0.28 $ 1.20
Diluted earnings per share $ 0.29 $ 0.29 $ 0.34 $ 0.28 $ 1.19
Weighted-average shares outstanding:
Basic 763.9 763.9 763.9 766.2 764.5
Diluted 763.9 763.9 764.0 782.3 768.6
Year Ended
December 31,
2005 by Quarter: Q1 Q2 Q3 Q4 2005
Revenues $ 919.6 $ 980.8 $1,019.3 $1,068.2 $3,987.9
Expenses 624.0 663.8 676.6 754.3 2,718.7
Other income, net 20.1 21.9 8.6 24.3 74.9
Income before income taxes 315.7 338.9 351.3 338.2 1,344.1
Income tax expense 97.9 105.1 109.4 104.3 416.7
Net income $ 217.8 $ 233.8 $ 241.9 $ 233.9 $ 927.4
Earnings per share:
Basic earnings per share $ 0.29 $ 0.31 $ 0.32 $ 0.31 $ 1.21
Diluted earnings per share $ 0.29 $ 0.31 $ 0.32 $ 0.31 $ 1.21
Weighted-average shares outstanding:
Basic 763.9 763.9 763.9 763.9 763.9
Diluted 763.9 763.9 763.9 763.9 763.9