Western Union 2006 Annual Report Download - page 46
Download and view the complete annual report
Please find page 46 of the 2006 Western Union annual report below. You can navigate through the pages in the report by either clicking on the pages listed below, or by using the keyword search tool below to find specific information within the annual report.-
 1
1 -
2
-
3
-
4
-
5
-
6
-
7
-
8
-
9
-
10
-
11
-
12
-
13
-
14
-
15
-
16
-
17
-
18
-
19
-
20
-
21
-
22
-
23
-
24
-
25
-
26
-
27
-
28
-
29
-
30
-
31
-
32
-
33
-
34
-
35
-
 36
36 -
 37
37 -
 38
38 -
 39
39 -
 40
40 -
 41
41 -
 42
42 -
 43
43 -
 44
44 -
 45
45 -
 46
46 -
 47
47 -
 48
48 -
 49
49 -
 50
50 -
 51
51 -
 52
52 -
 53
53 -
 54
54 -
 55
55 -
 56
56 -
57
-
58
-
59
-
60
-
61
-
62
-
63
-
64
-
65
-
66
-
67
-
68
-
69
-
70
-
71
-
72
-
73
-
74
-
75
-
76
-
77
-
78
-
79
-
80
-
81
-
82
-
83
-
84
-
85
-
86
-
87
-
88
-
89
-
90
-
91
-
92
-
93
-
94
-
95
-
96
-
97
-
98
-
99
-
100
-
101
-
102
-
103
-
104
 |
 |

WESTERN UNION 2006 Annual Report 44
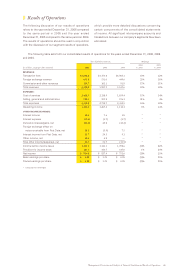
Revenues overview
The following provides highlights of revenue growth while
a more detailed discussion is included in “
—
Segment
Discussion”:
Transaction Fees and Foreign Exchange Revenue
The majority of transaction fees and foreign exchange
revenue are contributed from our consumer-to-consumer
segment, which is discussed in greater detail in “
—
Segment
Discussion.” Transaction fees and foreign exchange
revenue grew 12%, 12% and 13% during the years ended
December 31, 2006, 2005 and 2004 compared to the
previous year, respectively. Increased money transfers at
existing agent locations and, to a lesser extent, new agent
locations contributed to increased transaction volume and
fee revenue for each of those years. Our acquisition
of Vigo in October 2005 contributed $140.5 million in
total revenue during the year ended December 31, 2006
compared to $24.2 million during the year ended
December 31, 2005.
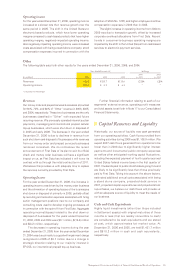
Fluctuations in the exchange ratio between the euro
and the United States dollar have resulted in the following
benefit or reduction to consumer-to-consumer revenue
over the previous year (which represents over 80% of our
consolidated transaction fee and foreign exchange revenue),
net of foreign currency hedges, that would not have
occurred had there been a constant exchange ratio
(in millions):
Year Ended December 31, Benefit /(Reduction)
2006 $11.5
2005 $ (1.4)
2004 $73.4
On a euro adjusted basis and excluding Vigo,
transaction fee and foreign exchange revenue increased
9%, 12% and 11% in 2006, 2005 and 2004 compared to
the respective previous year.
During 2006, Western Union’s business was adversely
impacted by the immigration debate and related activities
in the United States. This controversy around the subject
of immigration and the changes in the approach of various
government entities to the regulation of businesses that
employ or sell to immigrants has created fear and distrust
among some consumers who send money from the United
States to other countries, and among some consumers
who send money within the United States. As a result,
the frequency of money transfer transactions involving
these consumers has decreased and some competitors
have lowered prices and foreign exchange spreads in
certain markets. These and other issues adversely affected
our Mexico and United States domestic businesses, and
to a lesser extent our U.S. outbound businesses in 2006,
and we expect these issues to continue to impact our
businesses in the future. Certain actions taken by the
State of Arizona with respect to Western Union have added
to the uncertainty of some of our consumers. For more
discussion on this matter, refer to the consumer-to-
consumer segment discussion below.
Foreign exchange revenue increased for the years
ended December 31, 2006, 2005 and 2004 over each
respective previous period due to an increase in cross-
currency transactions primarily as a result of strong
growth in international consumer-to-consumer transactions
and the acquisition of Vigo. During the year ended
December 31, 2006, the increase in foreign exchange
revenue was partially offset by reduced foreign exchange
spreads in selected markets.
Commission and Other Revenues
During the years ended December 31, 2006, 2005 and
2004, commission and other revenues increased over
the previous corresponding period primarily as a result
of increased money order commissions due to higher
investment income on money orders pending settlement,
and higher enrollment fee income due to more customers
participating in the Equity Accelerator program. In addition,
2006 commission and other revenue benefited from higher
investment income on higher money transfer and payment
services settlement asset balances.
Operating Expenses Overview
The following provides highlights of our operating
expenses:
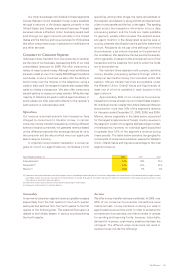
Cost of Services
Cost of services as a percentage of revenue was 54%,
53% and 52% for the years ended December 31, 2006,
2005 and 2004, respectively.
The majority of the increase in cost of services in
the year ended December 31, 2006 compared to 2005
was attributable to an increase in agent commissions
corresponding to the increase in revenue, and the shift in
our business mix reflecting stronger growth from our
international business, which carries higher cost of services
due to higher commission expense compared to our
domestic and Mexico businesses which carry lower cost
of services. Another factor impacting cost of services as
a percent of revenue is the October 2005 acquisition
of Vigo, which has higher cost of services compared
to Western Union branded money transfers. Higher
stock compensation costs in connection with the adoption
of SFAS No. 123R, and higher employee incentive
compensation expense have also contributed to the increase
in cost of services as a percent of revenue.
The majority of the increase in cost of services for
the year ended December 31, 2005 compared to 2004
was attributable to an increase in agent commissions
corresponding to the increase in revenue. In addition, an
$8.7 million impairment charge was recorded in 2005 due
to a change in strategic direction related to Eposs Limited,
or “Eposs,” a United Kingdom-based seller of cellular
prepaid services. We sold our majority interest in Eposs
on April 28, 2006. We also recognized an $8.2 million
charge in the fourth quarter of 2005 related to an additional
accrual of domestic and international escheatment liabilities
as further discussed in Note 5
—
“Commitments and
Contingencies” to our consolidated financial statements.