Western Union 2006 Annual Report Download - page 55
Download and view the complete annual report
Please find page 55 of the 2006 Western Union annual report below. You can navigate through the pages in the report by either clicking on the pages listed below, or by using the keyword search tool below to find specific information within the annual report.-
 1
1 -
2
-
3
-
4
-
5
-
6
-
7
-
8
-
9
-
10
-
11
-
12
-
13
-
14
-
15
-
16
-
17
-
18
-
19
-
20
-
21
-
22
-
23
-
24
-
25
-
26
-
27
-
28
-
29
-
30
-
31
-
32
-
33
-
34
-
35
-
36
-
37
-
38
-
39
-
40
-
41
-
42
-
43
-
44
-
 45
45 -
 46
46 -
 47
47 -
 48
48 -
 49
49 -
 50
50 -
 51
51 -
 52
52 -
 53
53 -
 54
54 -
 55
55 -
 56
56 -
 57
57 -
 58
58 -
 59
59 -
 60
60 -
 61
61 -
 62
62 -
 63
63 -
 64
64 -
 65
65 -
66
-
67
-
68
-
69
-
70
-
71
-
72
-
73
-
74
-
75
-
76
-
77
-
78
-
79
-
80
-
81
-
82
-
83
-
84
-
85
-
86
-
87
-
88
-
89
-
90
-
91
-
92
-
93
-
94
-
95
-
96
-
97
-
98
-
99
-
100
-
101
-
102
-
103
-
104
 |
 |

Management’s Discussion and Analysis of Financial Condition and Results of Operations 53
We used the net proceeds of the offering of the 2011
Notes, the 2036 Notes, and the Floating Rate Notes,
together with the proceeds of approximately $400 million
of commercial paper we issued, to repay the entire
$2.4 billion in principal amount outstanding under a bridge
loan facility entered into by our subsidiary FFMC, described
below. This repayment resulted in the release and
termination of certain guarantees entered into by FFMC
in connection with the spin-off relating to our 2016 Notes
and the Revolving Credit Facility.
Interest with respect to the 2011 Notes and 2036
Notes is payable semiannually on May 17 and November
17 each year based on fixed per annum interest rates of
5.400% and 6.200%, respectively. Interest with respect
to the Floating Rate Notes is payable quarterly in arrears
on February 17, May 17, August 17, and November 17
each year at a per annum rate equal to the three month
LIBOR plus 15 basis points, reset quarterly (5.52% at
December 31, 2006). The indenture governing the 2011
Notes, 2036 Notes and Floating Rate Notes contains
covenants that limit or restrict our ability and the ability
of our significant subsidiaries to incur debt (in the case of
significant subsidiaries), collateralize, sell, assign, transfer
or otherwise dispose of specified assets, or enter into sale
and leaseback transactions. We may redeem the 2011
Notes and the 2036 Notes at any time prior to maturity at
the applicable treasury rate plus 15 basis points and 25
basis points, respectively. We may redeem the Floating
Rate Notes at any time on or after May 17, 2007, at a
redemption price equal to 100% of the principal amount
of the Floating Rate Notes to be redeemed plus accrued
interest on the date of redemption.
In connection with the issuance of the 2011 Notes,
the 2016 Notes, the 2036 Notes, and the Floating Rate
Notes, we filed a registration statement on Form S-4 with
the SEC on December 22, 2006, which provided the holders
of the notes an offer to exchange their previously issued
notes for identical notes which have been registered. The
exchange offer closed on February 6, 2007.
Bridge Loan
On September 27, 2006, FFMC entered into an unsecured
bridge financing facility in an aggregate principal amount
of $2.4 billion (the “Bridge Loan”) with a syndicate of
lenders. On September 29, 2006, FFMC borrowed under
the Bridge Loan an aggregate principal amount equal
to $2.4 billion in connection with the spin-off. The Bridge
Loan was repaid on November 17, 2006 with proceeds
from the issuance of the 2011 Notes, 2036 Notes,
and Floating Rate Notes, together with the proceeds of
approximately $400 million of commercial paper we issued,
as described above.
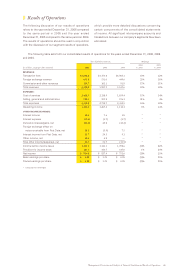
The following discussion highlights our cash flow
activities during the years ended December 31, 2006,
2005, and 2004.
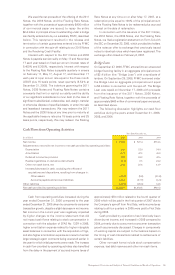
Cash Flows from Operating Activities
Years Ended December 31,
(in millions) 2006 2005 2004
Net income $ 914.0 $ 927.4 $751.6
Adjustments to reconcile net income to net cash provided by operating activities:
Depreciation 34.8 32.0 34.0
Amortization 68.7 47.5 45.2
Deferred income tax provision 12.9 24.9 47.6
Realized (gain)/loss on derivative instruments (4.1) 0.5 23.2
Other non-cash items, net 47.6 25.8 13.9
Increase/(decrease) in cash, excluding the effects of
acquisitions and dispositions, resulting from changes in:
Other assets (60.7) (8.8) (13.8)
Accounts payable and accrued liabilities 123.2 (17.9) (6.3)
Other liabilities (27.5) (28.6) 34.8
Net cash provided by operating activities $1,108.9 $1,002.8 $930.2
Cash from operating activities increased during the
year ended December 31, 2006 compared to the year
ended December 31, 2005 driven by consumer-to-consumer
transaction growth, despite a slight decrease in net income.
Net income in the current year was negatively impacted
by higher charges to the income statement that did
not impact cash flows relating to stock compensation in
connection with the adoption of SFAS No. 123R in 2006,
higher amortization expense related to higher intangible
asset balances in connection with the acquisition of Vigo,
and also higher amortization expense as a result of certain
large strategic agent contracts being executed earlier in
the year for which initial payments were made. The increase
in cash flow provided by operating activities also benefited
from the delay in the payment of accrued income taxes of
approximately $70 million related to the fourth quarter of
2006 which will be paid in the first quarter of 2007 due to
the Company’s spin-off from First Data, while income taxes
relating to all four quarters in 2005 were paid to First Data
during 2005.
Cash provided by operations has historically been
driven by net income, and increased in 2005 compared to
2004, primarily due to consumer-to-consumer transaction
growth as previously discussed. Changes in components
of working capital are subject to fluctuations based on
the timing of cash transactions related to settlements of
certain liabilities.
Other non-cash items include stock compensation
expense, bad debt reserves and other non-cash items.