Western Union 2006 Annual Report Download - page 52
Download and view the complete annual report
Please find page 52 of the 2006 Western Union annual report below. You can navigate through the pages in the report by either clicking on the pages listed below, or by using the keyword search tool below to find specific information within the annual report.-
 1
1 -
2
-
3
-
4
-
5
-
6
-
7
-
8
-
9
-
10
-
11
-
12
-
13
-
14
-
15
-
16
-
17
-
18
-
19
-
20
-
21
-
22
-
23
-
24
-
25
-
26
-
27
-
28
-
29
-
30
-
31
-
32
-
33
-
34
-
35
-
36
-
37
-
38
-
39
-
40
-
41
-
 42
42 -
 43
43 -
 44
44 -
 45
45 -
 46
46 -
 47
47 -
 48
48 -
 49
49 -
 50
50 -
 51
51 -
 52
52 -
 53
53 -
 54
54 -
 55
55 -
 56
56 -
 57
57 -
 58
58 -
 59
59 -
 60
60 -
 61
61 -
 62
62 -
63
-
64
-
65
-
66
-
67
-
68
-
69
-
70
-
71
-
72
-
73
-
74
-
75
-
76
-
77
-
78
-
79
-
80
-
81
-
82
-
83
-
84
-
85
-
86
-
87
-
88
-
89
-
90
-
91
-
92
-
93
-
94
-
95
-
96
-
97
-
98
-
99
-
100
-
101
-
102
-
103
-
104
 |
 |

WESTERN UNION 2006 Annual Report 50
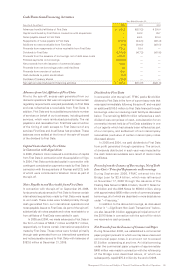
Foreign exchange revenue increased in 2005 compared
to 2004 due to an increase in the higher growth international
business resulting in increased cross-currency transactions.
In addition, growth in 2005 was impacted by the acquisition
of Vigo.
Operating Income
The consumer-to-consumer segment’s operating income
increased for the year ended December 31, 2006 compared
to the same period in 2005 as a result of the items
noted in “Transaction fees and foreign exchange revenue”
above. Operating income during the year ended
December 31, 2006 was impacted by a variety of other
factors including a shift in our business mix reflecting
stronger growth from our international business, which
carries lower profit margins than our U.S. to Mexico and
domestic businesses, higher stock compensation expense
incurred in connection with the adoption of SFAS No. 123R,
and a slight operating loss at Vigo. In addition, we incurred
incremental costs as a stand alone public company including
salaries, benefits, equipment, supplies and other costs
incurred in connection with operating departments that
were not part of our company prior to the spin-off, and are
incremental to both costs allocated by First Data prior to
the spin-off and presumed overhead allocations from First
Data had we remained part of First Data through the end
of 2006. Increased costs of being a stand alone company
also include stock compensation expenses incurred in
connection with stock awards granted on the spin-off date.
Employee incentive compensation expenses in 2006 were
higher than in 2005. The cost increases in 2006 described
above were partially offset by lower escheatment accruals
resulting from charges incurred in 2005 that did not recur
in 2006.
In line with our strategic objective of building the
Western Union brand, marketing related expenditures
increased during the year ended December 31, 2006 over
the comparable period in 2005. We expect to increase
marketing expenditures in 2007 and beyond.
Consumer-to-consumer operating income increased
for the year ended December 31, 2005 versus 2004
due to the increase in revenue, and employee incentive
compensation in 2005 compared to 2004, partially offset
by higher overhead allocations from First Data. Marketing
expenses increased in 2005 and 2004, but remained
relatively consistent as a percentage of total revenue.
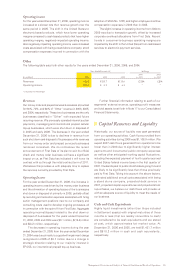
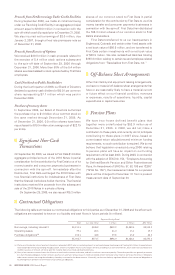
Consumer-to-Business Segment
The following table sets forth our consumer-to-business segment results of operations for the years ended
December 31, 2006, 2005, and 2004.
Years Ended December 31, % Change
2006 2005
(in millions) 2006 2005 2004 vs. 2005 vs. 2004
REVENUES:
Transaction fees $593.7 $565.0 $545.4 5% 4%
Other revenues 42.5 35.2 30.9 21% 14%
Total revenues $636.2 $600.2 $576.3 6% 4 %
Operating income $223.3 $220.4 $219.5 1% —%
Operating margin 35% 37% 38%
KEY INDICATORS:
Consumer-to-business transactions 249.4 215.1 192.6 16% 12%
Transaction Fees
Transaction and revenue growth in the year ended
December 31, 2006 compared to the same period in 2005
resulted from strong transaction growth in electronic
bill payments driven primarily by our Speedpay® and
Equity Accelerator services. The growth rates in 2006
compared to 2005 also benefited from cash bill payments
experiencing a slight revenue growth for the year ended
December 31, 2006 versus a decline in 2005. In addition,
our Western Union Convenience Pay
®
or “Convenience
Pay” business benefited from the addition of a large new
biller client in the third quarter of 2005 which had a positive
impact to transaction and revenue growth rates for the
year ended December 31, 2006 compared to the same
period in 2005. Reported transaction growth rates and, to
a lesser extent, reported revenue growth rates in the fourth
quarter of 2006 were negatively impacted as a result of
the anniversary date for the signing of this large biller client
occurring in the third quarter of 2005.
In December 2006, we acquired the remaining 75%
interest in SEPSA. Prior to the acquisition, we held a 25%
interest in SEPSA. This acquisition contributed $3.6 million
in revenue to our consumer-to-business segment in the
fourth quarter 2006. In 2006, revenue and transaction
growth compared to 2005, excluding SEPSA was 5% and
11%, respectively. We expect that SEPSA will continue
to benefit revenue and transaction growth rates throughout
most of 2007.
Transactio n f ee g rowth for the year ended
December 31, 2005 compared to the year ended
December 31, 2004 was driven by growth in our electronic
payment services as well as the new Convenience Pay
biller relationship discussed above.