Western Union 2006 Annual Report Download - page 86
Download and view the complete annual report
Please find page 86 of the 2006 Western Union annual report below. You can navigate through the pages in the report by either clicking on the pages listed below, or by using the keyword search tool below to find specific information within the annual report.-
 1
1 -
2
-
3
-
4
-
5
-
6
-
7
-
8
-
9
-
10
-
11
-
12
-
13
-
14
-
15
-
16
-
17
-
18
-
19
-
20
-
21
-
22
-
23
-
24
-
25
-
26
-
27
-
28
-
29
-
30
-
31
-
32
-
33
-
34
-
35
-
36
-
37
-
38
-
39
-
40
-
41
-
42
-
43
-
44
-
45
-
46
-
47
-
48
-
49
-
50
-
51
-
52
-
53
-
54
-
55
-
56
-
57
-
58
-
59
-
60
-
61
-
62
-
63
-
64
-
65
-
66
-
67
-
68
-
69
-
70
-
71
-
72
-
73
-
74
-
75
-
 76
76 -
 77
77 -
 78
78 -
 79
79 -
 80
80 -
 81
81 -
 82
82 -
 83
83 -
 84
84 -
 85
85 -
 86
86 -
 87
87 -
 88
88 -
 89
89 -
 90
90 -
 91
91 -
 92
92 -
 93
93 -
 94
94 -
 95
95 -
 96
96 -
97
-
98
-
99
-
100
-
101
-
102
-
103
-
104
 |
 |
WESTERN UNION 2006 Annual Report 84
SFAS No. 87 requires the sponsor of a defined benefit
plan to measure the plan’s obligations and annual expense
using assumptions that reflect best estimates and are
consistent to the extent that each assumption reflects
expectations of future economic conditions. As the bulk
of the pension benefits will not be paid for many years,
the computation of pension expenses and benefits is based
on assumptions about future interest rates and expected
rates of return on plan assets. In general, pension obligations
are most sensitive to the discount rate assumption, and it
is set based on the rate at which the pension benefits
could be settled effectively.
Western Union employs a building block approach in
determining the long-term rate of return for plan assets.
Historical markets are studied and long-term historical
relationships between equities and fixed-income securities
are preserved consistent with the widely accepted capital
market principle that assets with higher volatility generate
a greater return over the long run. Current market factors
such as inflation and interest rates are evaluated before
long-term capital market assumptions are determined. The
long-term portfolio return is established using a building
block approach with proper consideration of diversification
and re-balancing. Peer data and historical returns are
reviewed to check for reasonableness and appropriateness.
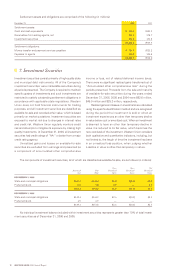
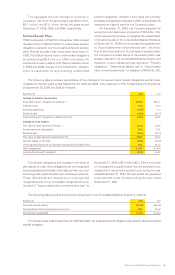
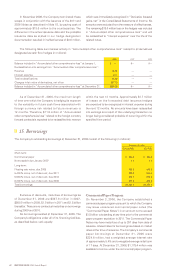
The following table provides the components of net periodic benefit income for the plans (in millions):
December 31, 2006 2005 2004
Interest cost $ 24.8 $ 25.6 $ 29.0
Expected return on plan assets (29.9) (33.8) (35.3)
Amortization of unrecognized actuarial loss 4.2 2.7 0.7
Net periodic benefit income $ (0.9) $ (5.5) $ (5.6)
The minimum pension liability included in other comprehensive income (loss), net of tax, decreased $10.8 million
and $4.9 million in 2006 and 2005, respectively, and increased $13.6 million in 2004.
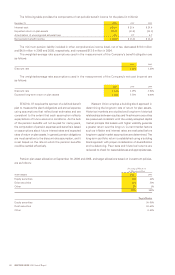
The weighted-average rate assumptions used in the measurement of the Company’s benefit obligation are
as follows:
2006 2005
Discount rate 5.61% 5.25%
The weighted-average rate assumptions used in the measurement of the Company’s net cost (income) are
as follows:
2006 2005 2004
Discount rate 5.24% 5.19% 5.90%
Expected long-term return on plan assets 7.50% 7.75% 8.00%
Pension plan asset allocation at September 30, 2006 and 2005, and target allocations based on investment policies,
are as follows:
Percentage of Plan Assets
at Measurement Date
Asset Category 2006 2005
Equity securities 40% 44%
Debt securities 58% 55%
Other 2% 1%
100% 100%
Target Allocation
Equity securities 30-50%
Debt securities 50-60%
Other 0-10%