Western Union 2006 Annual Report Download - page 80
Download and view the complete annual report
Please find page 80 of the 2006 Western Union annual report below. You can navigate through the pages in the report by either clicking on the pages listed below, or by using the keyword search tool below to find specific information within the annual report.-
 1
1 -
2
-
3
-
4
-
5
-
6
-
7
-
8
-
9
-
10
-
11
-
12
-
13
-
14
-
15
-
16
-
17
-
18
-
19
-
20
-
21
-
22
-
23
-
24
-
25
-
26
-
27
-
28
-
29
-
30
-
31
-
32
-
33
-
34
-
35
-
36
-
37
-
38
-
39
-
40
-
41
-
42
-
43
-
44
-
45
-
46
-
47
-
48
-
49
-
50
-
51
-
52
-
53
-
54
-
55
-
56
-
57
-
58
-
59
-
60
-
61
-
62
-
63
-
64
-
65
-
66
-
67
-
68
-
69
-
 70
70 -
 71
71 -
 72
72 -
 73
73 -
 74
74 -
 75
75 -
 76
76 -
 77
77 -
 78
78 -
 79
79 -
 80
80 -
 81
81 -
 82
82 -
 83
83 -
 84
84 -
 85
85 -
 86
86 -
 87
87 -
 88
88 -
 89
89 -
 90
90 -
91
-
92
-
93
-
94
-
95
-
96
-
97
-
98
-
99
-
100
-
101
-
102
-
103
-
104
 |
 |

WESTERN UNION 2006 Annual Report 78
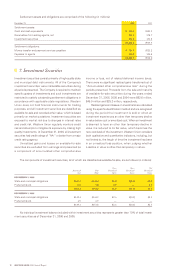
|| 7. Investment Securities
Investment securities consist primarily of high-quality state
and municipal debt instruments. All of the Company’s
investment securities were marketable securities during
all periods presented. The Company is required to maintain
specific grades of investments and such investments are
restricted to satisfy outstanding settlement obligations in
accordance with applicable state regulations. Western
Union does not hold financial instruments for trading
purposes, and all investment securities are classified as
available-for-sale and recorded at fair value, which is based
primarily on market quotations. Investment securities are
exposed to market risk due to changes in interest rates
and credit risk. Western Union regularly monitors credit
risk and attempts to mitigate its exposure by making high
quality investments. At December 31, 2006, all investment
securities had credit ratings of “AA-” or better from a major
credit rating agency.
Unrealized gains and losses on available-for-sale
securities are excluded from earnings and presented as
a component of accumulated other comprehensive
income or loss, net of related deferred income taxes.
There were no significant realized gains transferred out of
“Accumulated other comprehensive loss” during the
periods presented. Proceeds from the sale and maturity
of available-for-sale securities during the years ended
December 31, 2006, 2005 and 2004 were $62.6 million,
$49.0 million and $25.3 million, respectively.
Realized gains and losses on investments are calculated
using the specific-identification method and are recognized
during the period the investment is sold or when an
investment experiences an other than temporary decline
in value below cost or amortized cost. When an investment
is deemed to have an other than temporary decline in
value it is reduced to its fair value, which becomes the
new cost basis of the investment. Western Union considers
both qualitative and quantitative indicators, including, but
not limited to, the length of time the investment has been
in an unrealized loss position, when judging whether
a decline in value is other-than-temporary in nature.
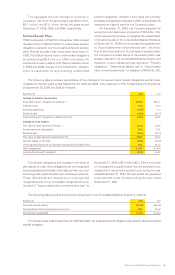
Settlement assets and obligations are comprised of the following (in millions):
December 31, 2006 2005
Settlement assets:
Cash and cash equivalents $ 348.8 $183.9
Receivables from selling agents, net 781.2 578.7
Investment securities 154.2 151.8
$1,284.2 $914.4
Settlement obligations:
Money transfer and payment services payables $ 714.5 $521.2
Payables to agents 568.0 390.8
$1,282.5 $912.0
The components of investment securities, all of which are classified as available-for-sale, are as follows (in millions):
Gross Gross Net
Amortized Fair Unrealized Unrealized Unrealized
Cost Value Gains Losses Gains
DECEMBER 31, 2006
State and municipal obligations $145.5 $146.4 $1.0 $(0.1) $0.9
Preferred stock 6.9 7.8 0.9 — 0.9
$152.4 $154.2 $1.9 $(0.1) $1.8
DECEMBER 31, 2005
State and municipal obligations $142.4 $144.9 $2.6 $(0.1) $2.5
Preferred stock 6.9 6.9 — — —
$149.3 $151.8 $2.6 $(0.1) $2.5
No individual investment balance included within investment securities represents greater than 10% of total invest-
ment securities as of December 31, 2006 and 2005.