Western Union 2006 Annual Report Download - page 51
Download and view the complete annual report
Please find page 51 of the 2006 Western Union annual report below. You can navigate through the pages in the report by either clicking on the pages listed below, or by using the keyword search tool below to find specific information within the annual report.-
 1
1 -
2
-
3
-
4
-
5
-
6
-
7
-
8
-
9
-
10
-
11
-
12
-
13
-
14
-
15
-
16
-
17
-
18
-
19
-
20
-
21
-
22
-
23
-
24
-
25
-
26
-
27
-
28
-
29
-
30
-
31
-
32
-
33
-
34
-
35
-
36
-
37
-
38
-
39
-
40
-
 41
41 -
 42
42 -
 43
43 -
 44
44 -
 45
45 -
 46
46 -
 47
47 -
 48
48 -
 49
49 -
 50
50 -
 51
51 -
 52
52 -
 53
53 -
 54
54 -
 55
55 -
 56
56 -
 57
57 -
 58
58 -
 59
59 -
 60
60 -
 61
61 -
62
-
63
-
64
-
65
-
66
-
67
-
68
-
69
-
70
-
71
-
72
-
73
-
74
-
75
-
76
-
77
-
78
-
79
-
80
-
81
-
82
-
83
-
84
-
85
-
86
-
87
-
88
-
89
-
90
-
91
-
92
-
93
-
94
-
95
-
96
-
97
-
98
-
99
-
100
-
101
-
102
-
103
-
104
 |
 |

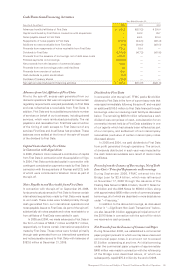
Management’s Discussion and Analysis of Financial Condition and Results of Operations 49
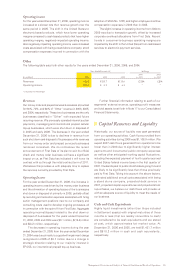
Fluctuations in the exchange ratio between the euro
and the United States dollar have resulted in the following
benefit or reduction to consumer-to-consumer revenue
over the previous year, net of foreign currency hedges,
that would not have occurred had there been a constant
exchange ratio (in millions):
Year Ended December 31, Benefit /(Reduction)
2006 $11.5
2005 $ (1.4)
2004 $73.4
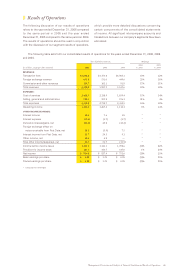
On a euro-adjusted basis, international revenue grew
16% for the year ended December 31, 2006, compared
to 16% in the comparable period in 2005, with Vigo
contributing 2% to the growth rates for the year ended
December 31, 2006.
The difference between international transaction
growth and revenue growth was relatively consistent during
the year ended December 31, 2006 compared to the
corresponding period in 2005. The slight increase in the
difference between international transaction growth and
revenue growth for the year ended December 31, 2006
was driven by Vigo transactions, which have lower revenue
per transaction compared to the Western Union branded
business. The impact from Vigo transactions was partially
offset by the stronger euro compared to 2005, which
benefited revenue growth, but not transaction growth.
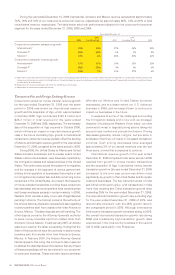
Growth in Mexico money transfer transactions for
the year ended December 31, 2006 compared to the same
period in 2005 was driven by the acquisition of Vigo
and growth in Western Union branded transactions,
partially offset by a decline in Orlandi Valuta branded
transactions. Revenues from Western Union branded
U.S. to Mexico transactions increased 6% for the year
ended December 31, 2006, compared to 26% for the same
period in 2005. The decline in revenue growth rates was
primarily due to the uncertainty created by the immigration
debate in the United States as described above.
Domestic transaction growth rates in the year ended
December 31, 2006 over the same period in 2005 declined
compared to increases observed for the year 2005 due in
part to the uncertainty created by the immigration debate
described above, and broader market softness experienced
within the United States domestic business in 2006.
Foreign exchange revenue increased for the year
ended December 31, 2006 due to the acquisition of Vigo
and an increase in the higher growth international business
resulting in increased cross-currency transactions.
Contributing to the increase in total consumer-to-
consumer money transfer revenue and transaction growth
in all periods presented was the growth in transactions
at existing agent locations, the number of agent locations
and marketing campaigns promoting Western Union
services. The majority of transaction growth is derived
from more mature agent locations as new agent locations
typically contribute only marginally to revenue growth in
the first few years of their operation. Increased productivity,
measured by transactions per location, often is experienced
as locations mature. We believe that new agent locations
will help drive growth by increasing the number of locations
available to send and receive money. We generally refer
to locations with more than 50% of transactions being
initiated versus paid out as “send locations” and to the
balance of locations as “receive locations.” Send locations
are the engine that drives consumer-to-consumer revenue.
They contribute more transactions per location than receive
locations. However, a wide network of receive locations
is necessary to build each corridor and help ensure global
distribution. The number of send and receive transactions
at an agent location can vary significantly due to such factors
as customer demographics around the location, immigration
patterns, the location’s class of trade, hours of operation,
length of time the location has been offering Western
Union services, regulatory limitations and competition.
Each of the nearly 300,000 agent locations in our agent
network is capable of providing one or more of our services;
however, not every location completes a transaction in a
given period. For example, as of December 31, 2006, more
than 85% of the combined locations in the United States,
Canada and Western Europe experienced money transfer
activity in the last 12 months. In the developing regions of
Asia and other areas where there are predominantly receive
locations, more than 65% of locations experienced money
transfer activity in the last 12 months. We periodically
review locations to determine whether they remain enabled
to perform money transfer transactions.
Consumer-to-consumer revenue growth in 2005 was
driven by growth in consumer-to-consumer transactions
and the acquisition of Vigo in October 2005. International
transaction growth benefited from growth in the United
States and European outbound businesses and strong
growth in China, India and the Philippines, including the
Philippines intra-country business. Consumer-to-consumer
revenue growth was also impacted by exchange rates. For
the year ended December 31, 2005, the exchange rates
between the euro and the United States dollar resulted in
a year-over-year negative impact to revenue of $1.4 million
compared to a benefit of $73.4 million in 2004, assuming
a constant exchange ratio (i.e., as if there were no change
in exchange rates from the same period in the
previous year) between the euro and the United States
dollar. Changes in exchange rates primarily impact
international revenue. On a euro-adjusted basis,
international revenue growth was 16% and 17% for the
years ended December 31, 2005 and 2004, respectively.
Growth in Mexico transactions for the year ended
December 31, 2005 was driven by growth in Western
Union branded transactions. The lower transaction
and revenue growth rates in domestic money transfer
for the year ended December 31, 2005 compared to 2004
are not attributable to any specific event.
The difference between international transaction
growth and revenue growth increased in 2005 compared
to 2004 primarily as a result of the negative currency
conversion impact of the euro compared to the benefit in
the prior year as noted above, which negatively impacted
revenue growth compared to the prior year. Intra-country
business is incremental to both transactions and revenue
but benefited transaction growth more than revenue growth.
Consumer-to-consumer pricing decreases, as a percentage
of our total revenue, were consistent from 2004 to 2005.