Western Union 2006 Annual Report Download - page 53
Download and view the complete annual report
Please find page 53 of the 2006 Western Union annual report below. You can navigate through the pages in the report by either clicking on the pages listed below, or by using the keyword search tool below to find specific information within the annual report.-
 1
1 -
2
-
3
-
4
-
5
-
6
-
7
-
8
-
9
-
10
-
11
-
12
-
13
-
14
-
15
-
16
-
17
-
18
-
19
-
20
-
21
-
22
-
23
-
24
-
25
-
26
-
27
-
28
-
29
-
30
-
31
-
32
-
33
-
34
-
35
-
36
-
37
-
38
-
39
-
40
-
41
-
42
-
 43
43 -
 44
44 -
 45
45 -
 46
46 -
 47
47 -
 48
48 -
 49
49 -
 50
50 -
 51
51 -
 52
52 -
 53
53 -
 54
54 -
 55
55 -
 56
56 -
 57
57 -
 58
58 -
 59
59 -
 60
60 -
 61
61 -
 62
62 -
 63
63 -
64
-
65
-
66
-
67
-
68
-
69
-
70
-
71
-
72
-
73
-
74
-
75
-
76
-
77
-
78
-
79
-
80
-
81
-
82
-
83
-
84
-
85
-
86
-
87
-
88
-
89
-
90
-
91
-
92
-
93
-
94
-
95
-
96
-
97
-
98
-
99
-
100
-
101
-
102
-
103
-
104
 |
 |

Management’s Discussion and Analysis of Financial Condition and Results of Operations 51
Operating income
For the year ended December 31, 2006, operating income
increased at a slower rate than revenue growth over the
same period in 2005. The shift in the United States to
electronic-based products, which have lower operating
margins compared to cash-based products that have higher
operating margins, negatively impacted operating income.
Also negatively impacting operating income were increased
costs associated with being a stand alone company, stock
compensation expenses incurred in connection with the
adoption of SFAS No. 123R, and higher employee incentive
compensation expenses in 2006 than in 2005.
The slight increase in operating income from 2004 to
2005 was due to transaction growth, offset by increased
corporate overhead allocations from First Data. Recent
trends in consumer-to-business operating margins are
impacted by the shift in the United States from cash-based
services to electronic payment services.
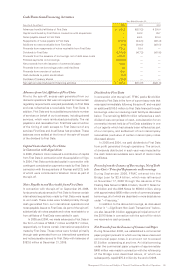
Other
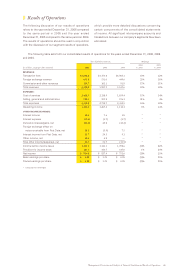
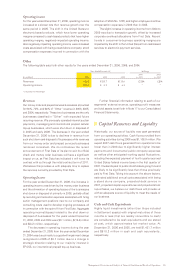
The following table sets forth other results for the years ended December 31, 2006, 2005, and 2004.
Years Ended December 31, % Change
2006 2005
(in millions) 2006 2005 2004 vs. 2005 vs. 2004
Revenues $90.0 $113.7 $115.6 (21)% (2)%
Operating income $18.4 $ 0.9 $ 6.1 * *
* Calculation not meaningful
Revenues
Our money order and prepaid services businesses accounted
for 94%, 70%, and 64% of “Other” revenue in 2006, 2005,
and 2004, respectively. These two businesses are the only
businesses classified in “Other” with expected future
recurring revenue. We previously operated internet auction
payments, messaging and international prepaid cellular
top-up businesses, which were shut down or disposed of
in 2005 and early 2006. The decrease in the year ended
December 31, 2006 is due to declines in revenue from
such shut down and disposed of businesses while revenues
from our money order and prepaid services businesses
remained consistent. We do not believe the recent
announcement of First Data of its plan to exit its official
check and money order business will have a significant
impact on us, as First Data has indicated it will honor its
contract with us through the initial contract term of 2011.
We believe this provides us with adequate time to replace
the services currently provided by First Data.
Operating Income
For the year ended December 31, 2006, the increase in
operating income was driven by the money order business
and the elimination of operating losses of the businesses
shut down or disposed of primarily in 2006, partially offset
by recruiting and relocation expenses associated with hiring
senior management positions new to our company and
consulting costs used to develop ongoing processes, all
in connection with the spin-off from First Data. Aggregate
operating income/(losses) related to the shut down or
disposed of businesses for the years ended December
31, 2006, 2005 and 2004 were $0.1 million, $(16.2) million
and $(8.2) million, respectively.
The decrease in operating income during the year
ended December 31, 2005 from the year ended December
31, 2004 was due primarily to a goodwill impairment charge
recognized in 2005 of $8.7 million due to a change in
strategic direction relating to our majority interest in
EPOSS, our international prepaid top-up business.
Further financial information relating to each of our
segments’ external revenue, operating profit measures
and total assets is set forth in Note 17 to our Consolidated
Financial Statements.
|| Capital Resources and Liquidity
Historically, our source of liquidity was cash generated
from our operating activities. Cash flows provided from
operating activities during 2006 was $1,108.9 million. We
expect 2007 cash flows generated from operations to be
lower than in 2006 due to significantly higher interest
payments and incremental public company expenses
as well as other anticipated working capital fluctuations,
including the expected payment of fourth quarter accrued
United States federal income taxes in the first quarter of
2007. Dividends paid to public stockholders going forward
are likely to be significantly less than those previously
paid to First Data. Taking into account the above factors,
estimated additional annual costs associated with being
a stand alone company, projected debt service in
2007, projected capital expenditures and projected stock
repurchases, we believe our cash flows will provide us
with an adequate source of liquidity to meet the needs of
our business.
Cash and Cash Equivalents
Highly liquid investments (other than those included
in Settlement assets) with original maturities of three
months or less (that are readily convertible to cash)
are considered to be cash equivalents and are stated
at cost, which approximates fair market value. At
December 31, 2006 and 2005, we held $1,421.7 million
and $510.2 million in cash and cash equivalents,
respectively.