Volvo 2002 Annual Report Download - page 90
Download and view the complete annual report
Please find page 90 of the 2002 Volvo annual report below. You can navigate through the pages in the report by either clicking on the pages listed below, or by using the keyword search tool below to find specific information within the annual report.-
 1
1 -
2
-
3
-
4
-
5
-
6
-
7
-
8
-
9
-
10
-
11
-
12
-
13
-
14
-
15
-
16
-
17
-
18
-
19
-
20
-
21
-
22
-
23
-
24
-
25
-
26
-
27
-
28
-
29
-
30
-
31
-
32
-
33
-
34
-
35
-
36
-
37
-
38
-
39
-
40
-
41
-
42
-
43
-
44
-
45
-
46
-
47
-
48
-
49
-
50
-
51
-
52
-
53
-
54
-
55
-
56
-
57
-
58
-
59
-
60
-
61
-
62
-
63
-
64
-
65
-
66
-
67
-
68
-
69
-
70
-
71
-
72
-
73
-
74
-
75
-
76
-
77
-
78
-
79
-
 80
80 -
 81
81 -
 82
82 -
 83
83 -
 84
84 -
 85
85 -
 86
86 -
 87
87 -
 88
88 -
 89
89 -
 90
90 -
 91
91 -
 92
92 -
 93
93 -
 94
94 -
 95
95 -
 96
96
 |
 |

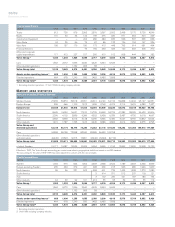
88/89
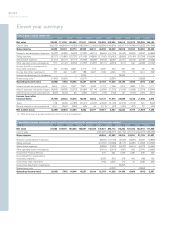
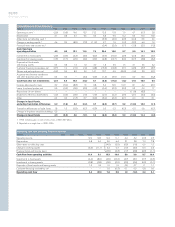
Eleven-year summary
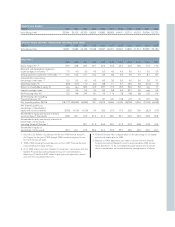
Net sales excluding Financial Services
SEKM 1992 1993 1994 1995 1996 1997 1998 1999 2000 2001 2002
Western Europe 27,932 30,874 39,518 40,301 40,610 44,190 54,156 59,858 61,942 93,147 92,331
Eastern Europe 536 666 1,100 1,512 1,906 2,769 4,074 2,714 3,676 6,383 7,437
Europe total 28,468 31,540 40,618 41,813 42,516 46,959 58,230 62,572 65,618 99,530 99,768
North America 8,625 14,052 16,521 17,510 15,729 24,699 34,705 41,382 38,029 54,630 50,206
South America 2,296 4,102 5,859 6,289 4,302 6,438 6,339 3,487 4,730 6,018 4,667
Asia 2,932 3,693 4,013 5,128 5,290 5,936 5,490 6,027 8,765 10,862 12,644
Other markets 1,415 1,787 1,765 1,610 2,445 3,086 2,866 2,914 3,250 9,575 9,795
Volvo Group excl
divested operations 43,736 55,174 68,776 72,350 70,282 87,118 107,630 116,382 120,392 180,615 177,080
Cars 44,598 58,158 73,598 83,340 83,589 96,453 103,798 – – – –
Other divested operations
and eliminations (6,445) (3,321) 12,315 10,851 (3,446) (5,040) (5,716) – – – –
Volvo Group total 81,889 110,011 154,689 166,541 150,425 178,531 205,712 116,382 120,392 180,615 177,080
of which, Sweden 10,117 12,087 12,524 10,034 9,264 9,995 11,192 12,842 13,920 12,928 12,120
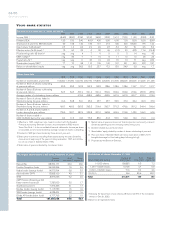
MARKET AREA STATI S T I CS
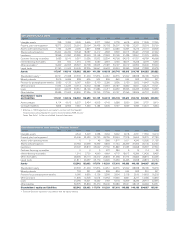
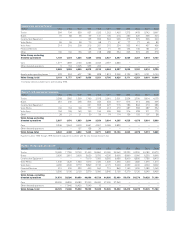
Capital expenditures
SEKM 1992 1993 1994 1995 1996 1997 1998 1999 2000 2001 2002
Trucks 912 725 979 2,063 2,576 2,397 2,552 2,468 3,175 5,725 4,546
Buses 101 64 54 124 199 276 320 571 364 324 229
Construction Equipment — — — 204 286 484 630 566 397 565 656
Volvo Penta 24 35 96 79 67 86 133 126 134 197 236
Volvo Aero 199 157 170 180 173 413 448 793 614 681 494
Financial Services 79 166 253 329 140 302 405 370
Other and corporate
capital expenditures 117 412 227 317 250 410 512 508 444 390 282
Volvo Group 11,353 1,393 1,526 3,046 3,717 4,319 4,924 5,172 5,430 8,287 6,813
Cars 1,562 2,072 1,596 2,540 4,425 5,544 5,625 — – – –
Other divested operations — — 1,152 905 58 — — — – – –
Volvo Group total 2,915 3,465 4,274 6,491 8,200 9,863 10,549 5,172 5,430 8,287 6,813
Assets under operating leases 1888 1,000 1,255 1,655 2,369 3,290 4,816 5,578 5,709 5,852 5,424
Divested operations 464 678 1,240 930 1,482 6,483 7,838 – – – –
Volvo Group total 21,352 1,678 2,495 2,585 3,851 9,773 12,654 5,578 5,709 5,852 5,424
1 Excluding divested operations. 2 Until 1996 including company vehicles.
Effective in 1997, The Volvo Group’s accounting per market area reflects geographical definitions based on an ISO standard.
The accounting for the years 1992–1996 has been adjusted to conform with the new principle.
Capital expenditures
SEKM 1992 1993 1994 1995 1996 1997 1998 1999 2000 2001 2002
Sweden 1,004 970 824 1,962 2,333 2,558 2,622 1,789 2,453 4,638 3,699
Europe, excluding Sweden 230 264 279 421 608 609 913 966 985 1,946 1,600
North America 55 96 331 502 558 601 735 1,425 1,538 1,370 1,080
South America 3 414 371 512 237 118 121
Asia 3102 230 441 187 180 194
Other markets 64 63 92 161 212 35 53 39 30 35 119
Volvo Group 11,353 1,393 1,526 3,046 3,717 4,319 4,924 5,172 5,430 8,287 6,813
Cars 1,562 2,072 1,596 2,540 4,425 5,544 5,625 — – – –
Other divested operations — — 1,152 905 58 — — — – – –
Volvo Group total 2,915 3,465 4,274 6,491 8,200 9,863 10,549 5,172 5,430 8,287 6,813
Assets under operating leases 1888 1,000 1,255 1,655 2,369 3,290 4,816 5,578 5,709 5,852 5,424
Divested operations 464 678 1,240 930 1,482 6,483 7,838 – – – –
Volvo Group total 21,352 1,678 2,495 2,585 3,851 9,773 12,654 5,578 5,709 5,852 5,424
1 Excluding divested operations.
2 Until 1996 including company vehicles.