Volvo 2002 Annual Report Download - page 27
Download and view the complete annual report
Please find page 27 of the 2002 Volvo annual report below. You can navigate through the pages in the report by either clicking on the pages listed below, or by using the keyword search tool below to find specific information within the annual report.-
 1
1 -
2
-
3
-
4
-
5
-
6
-
7
-
8
-
9
-
10
-
11
-
12
-
13
-
14
-
15
-
16
-
 17
17 -
 18
18 -
 19
19 -
 20
20 -
 21
21 -
 22
22 -
 23
23 -
 24
24 -
 25
25 -
 26
26 -
 27
27 -
 28
28 -
 29
29 -
 30
30 -
 31
31 -
 32
32 -
 33
33 -
 34
34 -
 35
35 -
 36
36 -
 37
37 -
38
-
39
-
40
-
41
-
42
-
43
-
44
-
45
-
46
-
47
-
48
-
49
-
50
-
51
-
52
-
53
-
54
-
55
-
56
-
57
-
58
-
59
-
60
-
61
-
62
-
63
-
64
-
65
-
66
-
67
-
68
-
69
-
70
-
71
-
72
-
73
-
74
-
75
-
76
-
77
-
78
-
79
-
80
-
81
-
82
-
83
-
84
-
85
-
86
-
87
-
88
-
89
-
90
-
91
-
92
-
93
-
94
-
95
-
96
 |
 |

engine development and each applica-
tion, to ensure the right combination of
engine, transmission, chassis and body.
The new I-shift transmission used in the
Volvo Trucks is an excellent example of
this integration.
The striving for higher fuel efficiency
and lighter components requires that new
material technologies are being de-
veloped also for engines. The so-called
FPC method developed for use in the
Skövde foundry produces a material with
higher strength and thus withstanding
higher combustion pressure. The method
was acknowledged by the international
foundry organization WFO by its first
environmental prize in June 2002. Among
the side-effects are also higher energy
efficiency and less handling of hazardous
waste in the foundry process.
Climate change
The focus on fuel efficiency is the Group’s
strongest contribution to reducing green-
house gas emissions. The specific fuel
consumption for each product must be
minimized. Total efficiency will also be
improved through the development and
use of information technology and intelligent
planning systems.
A road-map for alternative fuels and
powertrains for the products is being
developed, taking advantage of the deep
knowledge on how to keep the efficiency
of the diesel engine technology also with
other fuels. DME is further investigated
with test vehicles, and most importantly
also the fuel production and distribution
prerequisites for an overall efficient solution.
The focused environmental agenda
defines far-reaching objectives for energy
efficiency also in the production process-
es. The organisation is now being chal-
lenged on how to achieve substantially
decreased CO2emissions in the most
cost-effective way.
The production impact
The Volvo Group has production sites on
all continents. Minimum environmental
performance and an on-going improve-
ment program are required from all plants,
and followed-up by regular audits since
1989. The environmental audits identify
environmental risks and possible need for
clean-up or other corrective actions, with
a follow-up that these are promptly con-
ducted. The Volvo Group has insurance
coverage for possible accidental damage
to nearby areas.
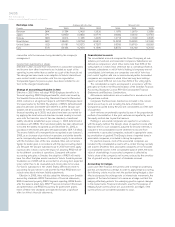
At the beginning of 2003, Volvo had a
total of 48 plants for the production of
trucks, buses, construction equipment, mar-
ine and industrial power systems, and air-
craft engines, of which 16 in Sweden. All
the plants have the requisite permits, which
in Sweden cover waste, noise and emis-
sions to air, water and soil. No Swedish
permits are to be renewed during 2003.
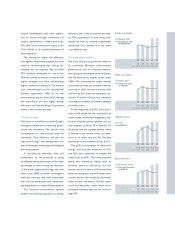
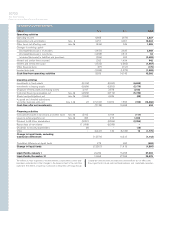
The 2002 consumption of water and
energy, and thus the emissions of CO2
and NOxhave remained on roughly the
same levels as 2001. The newly acquired
plants have started an intense work to
increase resource efficiency, but the
results cannot be seen yet. However their
focus on changing to fuel with lower sulfur
content shows clear results by decreased
sulfur dioxide emissions. Solvent emis-
sions and hazardous waste show minor
increases. Detailed data can be found on
page 89.
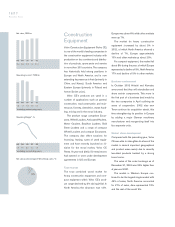
98 99 00 01 02
1. 8 1. 8 1.72.62.6
Energy consumption
Energy, TWh
Energy/net sales
MWh/SEK M
16 .5 15.6 13.8 14.3 14.5
98 99 00 01 02
5.3 6.7 6.1 9.2 9.2
Water consumption
Water, Mm3
Water/net sales
m3/SEK M
49.1 57.8 51.0 50.9 52.0
98 99 00 01 02
10.8 15.6 17.2 20.3 20.5
Hazardous waste
k ton
kg/SEK M
101 13 4 143 112 116
98 99 00 01 02
1.1 1.3 1.4 1.8 1.9
Solvent emission
Emissions, k ton
Emission/net sales
kg/SEK M
10.0 11.4 11.8 10.1 10.7