Volvo 2002 Annual Report Download - page 32
Download and view the complete annual report
Please find page 32 of the 2002 Volvo annual report below. You can navigate through the pages in the report by either clicking on the pages listed below, or by using the keyword search tool below to find specific information within the annual report.-
 1
1 -
2
-
3
-
4
-
5
-
6
-
7
-
8
-
9
-
10
-
11
-
12
-
13
-
14
-
15
-
16
-
17
-
18
-
19
-
20
-
21
-
 22
22 -
 23
23 -
 24
24 -
 25
25 -
 26
26 -
 27
27 -
 28
28 -
 29
29 -
 30
30 -
 31
31 -
 32
32 -
 33
33 -
 34
34 -
 35
35 -
 36
36 -
 37
37 -
 38
38 -
 39
39 -
 40
40 -
 41
41 -
 42
42 -
43
-
44
-
45
-
46
-
47
-
48
-
49
-
50
-
51
-
52
-
53
-
54
-
55
-
56
-
57
-
58
-
59
-
60
-
61
-
62
-
63
-
64
-
65
-
66
-
67
-
68
-
69
-
70
-
71
-
72
-
73
-
74
-
75
-
76
-
77
-
78
-
79
-
80
-
81
-
82
-
83
-
84
-
85
-
86
-
87
-
88
-
89
-
90
-
91
-
92
-
93
-
94
-
95
-
96
 |
 |

30/31
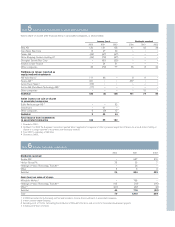
The Volvo Group
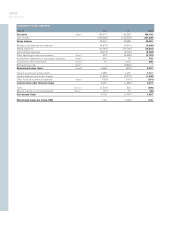
Consolidated income statements
SEK M 2000 2001 2002
Net sales Note 3 130,070 189,280 186,198
Cost of sales (104,548) (155,592) (151,569)
Gross income 25,522 33,688 34,629
Research and development expenses (4,876) (5,391) (5,869)
Selling expenses (10,140) (15,766) (16,604)
Administrative expenses (4,974) (6,709) (5,658)
Other operating income and expenses Note 4 622 (4,096) (4,152)
Income from investments in associated companies Note 5 444 50 182
Income from other investments Note 6 70 1,410 309
Restructuring costs Note 7 –(3,862) –
Operating income (loss) Note 8 6,668 (676) 2,837
Interest income and similar credits 1,588 1,275 1,217
Interest expenses and similar charges (1,845) (2,274) (1,840)
Other financial income and expenses Note 9 (165) (191) (201)
Income (loss) after financial items 6,246 (1,866) 2,013
Taxes Note 10 (1,510) 326 (590)
Minority interests in net income (loss) Note 11 (27) 73 (30)
Net income (loss) 4,709 (1,467) 1,393
Net income (loss) per share, SEK 11.20 (3.50) 3.30