Volvo 2002 Annual Report Download - page 33
Download and view the complete annual report
Please find page 33 of the 2002 Volvo annual report below. You can navigate through the pages in the report by either clicking on the pages listed below, or by using the keyword search tool below to find specific information within the annual report.-
 1
1 -
2
-
3
-
4
-
5
-
6
-
7
-
8
-
9
-
10
-
11
-
12
-
13
-
14
-
15
-
16
-
17
-
18
-
19
-
20
-
21
-
22
-
 23
23 -
 24
24 -
 25
25 -
 26
26 -
 27
27 -
 28
28 -
 29
29 -
 30
30 -
 31
31 -
 32
32 -
 33
33 -
 34
34 -
 35
35 -
 36
36 -
 37
37 -
 38
38 -
 39
39 -
 40
40 -
 41
41 -
 42
42 -
 43
43 -
44
-
45
-
46
-
47
-
48
-
49
-
50
-
51
-
52
-
53
-
54
-
55
-
56
-
57
-
58
-
59
-
60
-
61
-
62
-
63
-
64
-
65
-
66
-
67
-
68
-
69
-
70
-
71
-
72
-
73
-
74
-
75
-
76
-
77
-
78
-
79
-
80
-
81
-
82
-
83
-
84
-
85
-
86
-
87
-
88
-
89
-
90
-
91
-
92
-
93
-
94
-
95
-
96
 |
 |

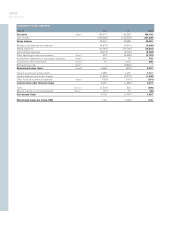
Consolidated balance sheets
SEK M December 31, 2000 December 31, 2001 December 31, 2002
Assets
Non-current assets
Intangible assets Note 12 6,925 17,525 17,045
Tangible assets Note 12
Property, plant and equipment 22,231 33,234 30,799
Assets under operating leases 14,216 36,447 27,101 60,335 23,525 54,324
Financial assets
Shares and participations Note 13 30,481 27,798 27,492
Long-term customer-financing receivables Note 14 22,909 26,075 25,207
Other long-term receivables Note 15 7,264 60,654 14,456 68,329 12,485 65,184
Total non-current assets 104,026 146,189 136,553
Current assets
Inventories Note 16 23,551 31,075 28,305
Short-term receivables
Customer-financing receivables Note 17 18,882 22,709 21,791
Other receivables Note 18 38,316 57,198 33,569 56,278 26,995 48,786
Marketable securities Note 19 9,568 13,514 16,707
Cash and bank accounts Note 20 6,400 13,869 8,871
Total current assets 96,717 114,736 102,669
Total assets 200,743 260,925 239,222
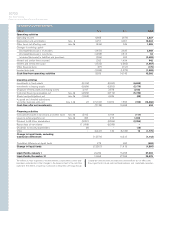
Shareholders’ equity and liabilities
Shareholders’ equity Note 21
Restricted equity
Share capital 2,649 2,649 2,649
Restricted reserves 13,804 16,453 12,297 14,946 14,093 16,742
Unrestricted equity
Unrestricted reserves 67,176 71,706 60,143
Net income (loss) 4,709 71,885 (1,467) 70,239 1,393 61,536
Total shareholders’ equity 88,338 85,185 78,278
Minority interests Note 11 593 391 247
Provisions
Provisions for post-employment benefits Note 22 2,632 14,647 16,236
Provisions for deferred taxes 2,264 1,044 912
Other provisions Note 23 12,676 17,572 17,383 33,074 15,809 32,957
Non-current liabilities Note 24
Bond loans 30,872 30,715 33,870
Other loans 9,533 14,036 12,549
Other long-term liabilities 265 40,670 9,379 54,130 6,704 53,123
Current liabilities Note 25
Loans 25,828 36,817 26,018
Trade payables 11,377 23,115 22,214
Other current liabilities 16,365 53,570 28,213 88,145 26,385 74,617
Total shareholders’ equity and liabilities 200,743 260,925 239,222
Assets pledged Note 26 2,990 3,737 3,610
Contingent liabilities Note 27 6,789 10,441 9,334