Volvo 2002 Annual Report Download - page 16
Download and view the complete annual report
Please find page 16 of the 2002 Volvo annual report below. You can navigate through the pages in the report by either clicking on the pages listed below, or by using the keyword search tool below to find specific information within the annual report.-
 1
1 -
2
-
3
-
4
-
5
-
 6
6 -
 7
7 -
 8
8 -
 9
9 -
 10
10 -
 11
11 -
 12
12 -
 13
13 -
 14
14 -
 15
15 -
 16
16 -
 17
17 -
 18
18 -
 19
19 -
 20
20 -
 21
21 -
 22
22 -
 23
23 -
 24
24 -
 25
25 -
 26
26 -
27
-
28
-
29
-
30
-
31
-
32
-
33
-
34
-
35
-
36
-
37
-
38
-
39
-
40
-
41
-
42
-
43
-
44
-
45
-
46
-
47
-
48
-
49
-
50
-
51
-
52
-
53
-
54
-
55
-
56
-
57
-
58
-
59
-
60
-
61
-
62
-
63
-
64
-
65
-
66
-
67
-
68
-
69
-
70
-
71
-
72
-
73
-
74
-
75
-
76
-
77
-
78
-
79
-
80
-
81
-
82
-
83
-
84
-
85
-
86
-
87
-
88
-
89
-
90
-
91
-
92
-
93
-
94
-
95
-
96
 |
 |

14/15
Business Areas
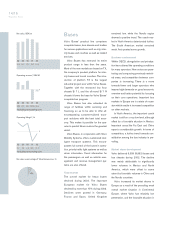
Buses
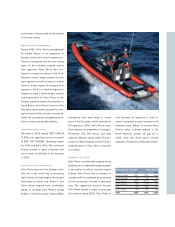
Volvo Buses’ product line comprises
complete buses, bus chassis and bodies
for various applications such as city, inter-
city buses and coaches as well as related
services.
Volvo Buses has renewed its entire
product range in less than five years.
Most of the new models are based on TX,
the company’s product platform for inter-
city buses and tourist coaches. The intro-
duction of platform TX is the largest
industrial project ever within Volvo Buses.
Together with the renowned low floor
chassis B 7 L and the all-round B 7 R
chassis it forms the base for Volvo Buses’
complete bus program.
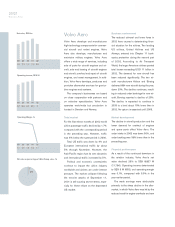
Volvo Buses has also extended its
range of facilities within servicing and
financing, so as to be able to offer all-
encompassing customer-tailored trans-
port solutions with the best total econ-
omy. This makes it possible for the ope-
rator to predict future costs in the greatest
detail.
Volvo Buses, in cooperation with Volvo
Mobility Systems, offers customized intel-
ligent transport systems. This encom-
passes full control of the buses in opera-
tion, priority traffic light systems as well as
driver information. Travel information for
the passengers as well as vehicle man-
agement and revenue management sys-
tems are also offered.
Tot a l market
The overall market for heavy buses
declined during 2002. The important
European market for Volvo Buses
declined by more than 15% during 2002.
Declines were posted in Germany,
France and Spain. United Kingdom
remained low, while the Nordic region
showed a positive trend. The coach mar-
ket in North America deteriorated further.
The South American market remained
weak. Asia posted some growth.
Business environment
Within OECD, deregulation and privatiza-
tion have altered the operating conditions
for many operators. New actors are pene-
trating and conquering previously restrict-
ed areas, and competition between com-
panies is increasing. There is a move
towards fewer and larger operators who
impose high demands on good economic
overview and better potential for focusing
on their core operations. Important bus
markets in Europe are in a state of reces-
sion which results in increased competition
on other markets.
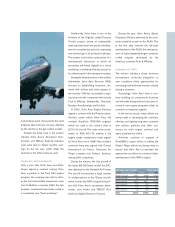
In North America, the important coach
market is still on a very low level, although
offset by a favorable situation in Mexico.
Important areas like Far East and China
report a considerable growth. In terms of
competitors, a further trend towards con-
solidation among the bus industry is pre-
vailing.
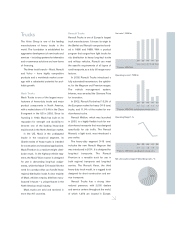
Market share development
Volvo delivered 9,059 (9,953) buses and
bus chassis during 2002. The decline
was mainly attributable to significantly
lower volumes in Mexico and North
America, which were offset to some
extent by favorable volumes in China and
the Nordic countries.
Volvo increased its market shares in
Europe as a result of the prevailing weak
overall market situation in Continental
Europe, where Volvo has relatively low
penetration, and the favorable situation in
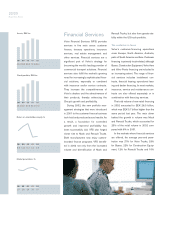
98 99 00 01 02
14 .3 14 .7 17.2 16.7 14.0
Net sales, SEK bn
98 99 00 01 02
385 224 440 (524) (94)
Operating income*, SEK M
98 99 00 01 02
2.71.5 2.6 (3.1) (0.7)
Operating Margin*, %
Net sales as percentage of Volvo Group sales, %
0
0
*excluding restructuring costs
*excluding restructuring costs
8%