Volvo 2002 Annual Report Download - page 40
Download and view the complete annual report
Please find page 40 of the 2002 Volvo annual report below. You can navigate through the pages in the report by either clicking on the pages listed below, or by using the keyword search tool below to find specific information within the annual report.-
 1
1 -
2
-
3
-
4
-
5
-
6
-
7
-
8
-
9
-
10
-
11
-
12
-
13
-
14
-
15
-
16
-
17
-
18
-
19
-
20
-
21
-
22
-
23
-
24
-
25
-
26
-
27
-
28
-
29
-
 30
30 -
 31
31 -
 32
32 -
 33
33 -
 34
34 -
 35
35 -
 36
36 -
 37
37 -
 38
38 -
 39
39 -
 40
40 -
 41
41 -
 42
42 -
 43
43 -
 44
44 -
 45
45 -
 46
46 -
 47
47 -
 48
48 -
 49
49 -
 50
50 -
51
-
52
-
53
-
54
-
55
-
56
-
57
-
58
-
59
-
60
-
61
-
62
-
63
-
64
-
65
-
66
-
67
-
68
-
69
-
70
-
71
-
72
-
73
-
74
-
75
-
76
-
77
-
78
-
79
-
80
-
81
-
82
-
83
-
84
-
85
-
86
-
87
-
88
-
89
-
90
-
91
-
92
-
93
-
94
-
95
-
96
 |
 |

38/39
The Volvo Group
Notes to consolidated financial statements
Note 3Net sales
Net sales per business and market area are shown in tables on page 85.
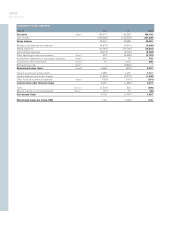
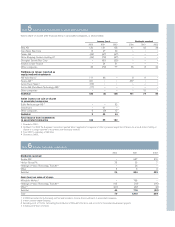
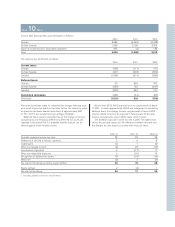
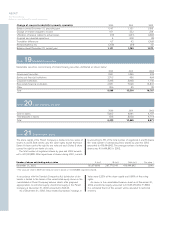
Note 4Other operating income and expenses
The effects during 2002, 2001 and 2000 on the Volvo Group’s bal-
ance sheet and cash flow statement in connection with the divest-
ment of subsidiaries and other business units are specified in
the following table:
2000 2001 2002
Intangible assets (17) (354) –
Property, plant and equipment (132) (288) (5)
Shares and participations 7 – –
Inventories (69) (939) (23)
Other receivables (93) (12,139) (43)
Liquid funds (7) (1,824) (13)
Minority interests 10 176 –
Provisions 158 2,922 –
Loans 38 420 –
Other liabilities 172 583 52
Divested net assets 67 (11,443) (32)
Liquid funds received 506 11,860 32
Liquid funds, divested
companies (7) (1,824) (13)
Effect on Group
liquid funds 499 10,036 19
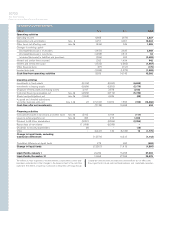
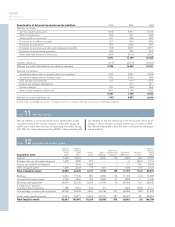
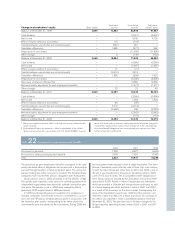
The effects during 2002, 2001 and 2000 on the Volvo Group’s bal-
ance sheet and cash flow statement in connection with the acquisi-
tion of subsidiaries and other business units are specified in
the following table:
2000 2001 2002
Intangible assets 125 8,914 135
Property, plant and equipment 68 9,126 95
Assets under operating lease – 10,195 286
Shares and participations (9) 433 (214)
Inventories 348 9,361 234
Current receivables 300 8,774 382
Liquid funds 2 4,059 105
Other assets 1 7,674 3
Shareholders’ equity – (10,356) –
Minority interests – – 119
Provisions (7) (14,524) (33)
Loans (89) (2,543) (247)
Liabilities (237) (30,020) (582)
Acquired net assets 502 1,093 283
Liquid funds paid (502) (1,093) (283)
Liquid funds according to
acquisition analysis 2 4,059 105
Effect on Group
liquid funds (500) 2,966 (178)
The effects during 2002 includes wholly owned subsidiaries that
previously were accounted for according to the equity method.
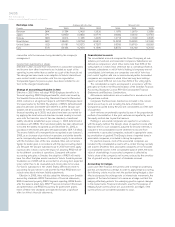
2000 2001 2002
Losses on forward and options contracts (700) (2,044) (195)
Exchange rate differences on trade receivables and payables 436 411 (266)
Amortization of goodwill (491) (1,058) (1,094)
Change in allowances for doubtful receivables, customer financing (397) (1,326) (1,018)
Change in allowances for doubtful receivables, other (172) (415) (362)
Surplus funds from Alecta (previously SPP) 683 43 –
Gain on sale of Volvia’s securities portfolio 610 – –
Gain on sale of Volvia’s insurance operations – 562 –
Adjustment of the gain on sale of Volvo Cars 520 90 –
Other income and expenses 133 (359) (1,217)
Total 622 (4,096) (4,152)