Volvo 2002 Annual Report Download - page 51
Download and view the complete annual report
Please find page 51 of the 2002 Volvo annual report below. You can navigate through the pages in the report by either clicking on the pages listed below, or by using the keyword search tool below to find specific information within the annual report.-
 1
1 -
2
-
3
-
4
-
5
-
6
-
7
-
8
-
9
-
10
-
11
-
12
-
13
-
14
-
15
-
16
-
17
-
18
-
19
-
20
-
21
-
22
-
23
-
24
-
25
-
26
-
27
-
28
-
29
-
30
-
31
-
32
-
33
-
34
-
35
-
36
-
37
-
38
-
39
-
40
-
 41
41 -
 42
42 -
 43
43 -
 44
44 -
 45
45 -
 46
46 -
 47
47 -
 48
48 -
 49
49 -
 50
50 -
 51
51 -
 52
52 -
 53
53 -
 54
54 -
 55
55 -
 56
56 -
 57
57 -
 58
58 -
 59
59 -
 60
60 -
 61
61 -
62
-
63
-
64
-
65
-
66
-
67
-
68
-
69
-
70
-
71
-
72
-
73
-
74
-
75
-
76
-
77
-
78
-
79
-
80
-
81
-
82
-
83
-
84
-
85
-
86
-
87
-
88
-
89
-
90
-
91
-
92
-
93
-
94
-
95
-
96
 |
 |

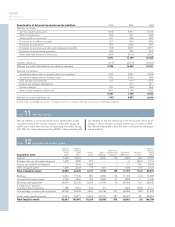
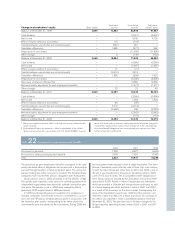
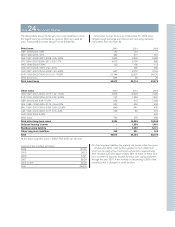
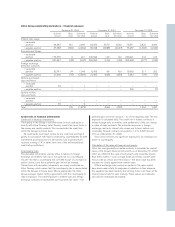
Other loans 2000 2001 2002
USD 1997–2001/2003–2017 1.42–13.0% 4,905 10,023 7,280
EUR 1990–2002/2004–2014 3.22–9.59% 747 1,453 1,841
GBP 2002/2005 4.44–7.18% 858 915 1,028
SEK 1988–1999/2009–2013, 4.3–6.15% 822 650 224
BRL 1998–2001/2004–2009 7.85–21.64% 849 641 435
CAD 1996–2002/2008–2017 3.55–4.0% 558 80 972
AUD 2002/2006 5.32% – – 400
Other loans 795 274 369
Total other long-term loans 9,534 14,036 12,549
Deferred leasing income – 1,898 1,481
Residual value liability – 7,250 5,121
Other long-term liabilities 265 231 102
Total 40,670 54,130 53,123
Of the above long-term loans, 1,358 (1,703; 693) was secured.
Long-term loans mature as follows:
2004 15,732
2005 9,813
2006 4,227
2007 8,624
2008 or later 8,023
Total 46,419
Of other long-term liabilities the majority will mature within five years.
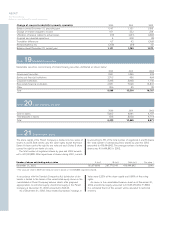
At year-end 2002, credit facilities granted but not utilized and
which can be used without restrictions amounted to approximately
SEK 18 billion (22; 23). Approximately SEK 16 billion of these facil-
ities consisted of stand-by facilities for loans with varying maturities
through the year 2007. A fee normally not exceeding 0.25% of the
unused portion is charged for credit facilities.
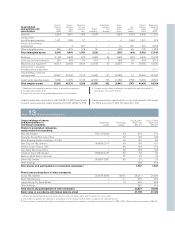
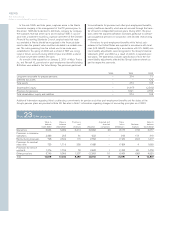
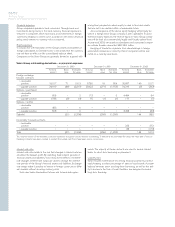
Note 24Non-current liabilities
Bond loans 2000 2001 2002
GBP 1999/2003, 4.6% 142 154 –
DKK 1998/2005, 4.0% 389 317 310
SEK 1997–2002/2004–2008, 4.05–9.8% 2,952 2,502 5,950
JPY 1999–2002/2004–2011, 0.3–1.7% 4,812 2,130 888
HKD 1999/2006 7.99% 122 136 113
CZK, 2001/2004–2007, 2.92–6.5% – 466 306
USD 1997–2001/2004–2008, 1.42–6.0% 667 2,070 2,154
EUR 1995–2002/2004–2010, 0.1–7.62% 21,144 22,907 24,120
Other bond loans 644 33 29
Total bond loans 30,872 30,715 33,870
The listing below shows the Group’s non-current liabilities in which
the largest loans are distributed by currency. Most are issued by
Volvo Treasury AB and Volvo Group Finance Europe BV.
Information on loan terms is as of December 31, 2002. Volvo
hedges foreign-exchange and interest-rate risks using derivative
instruments. See also Note 32.