Volvo 2002 Annual Report Download - page 60
Download and view the complete annual report
Please find page 60 of the 2002 Volvo annual report below. You can navigate through the pages in the report by either clicking on the pages listed below, or by using the keyword search tool below to find specific information within the annual report.-
 1
1 -
2
-
3
-
4
-
5
-
6
-
7
-
8
-
9
-
10
-
11
-
12
-
13
-
14
-
15
-
16
-
17
-
18
-
19
-
20
-
21
-
22
-
23
-
24
-
25
-
26
-
27
-
28
-
29
-
30
-
31
-
32
-
33
-
34
-
35
-
36
-
37
-
38
-
39
-
40
-
41
-
42
-
43
-
44
-
45
-
46
-
47
-
48
-
49
-
 50
50 -
 51
51 -
 52
52 -
 53
53 -
 54
54 -
 55
55 -
 56
56 -
 57
57 -
 58
58 -
 59
59 -
 60
60 -
 61
61 -
 62
62 -
 63
63 -
 64
64 -
 65
65 -
 66
66 -
 67
67 -
 68
68 -
 69
69 -
 70
70 -
71
-
72
-
73
-
74
-
75
-
76
-
77
-
78
-
79
-
80
-
81
-
82
-
83
-
84
-
85
-
86
-
87
-
88
-
89
-
90
-
91
-
92
-
93
-
94
-
95
-
96
 |
 |
58/59
The Volvo Group
Notes to consolidated financial statements
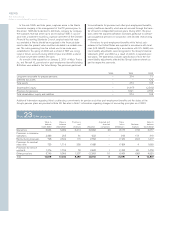
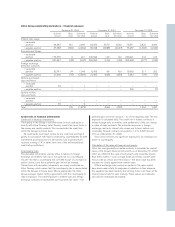
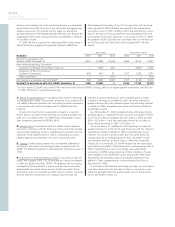
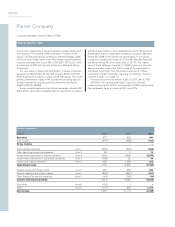
Estimated fair value of Volvo’s financial instruments
December 31, 2000 December 31, 2001 December 31, 2002
Book Fair Book Fair Book Fair
value value value value value value
Balance sheet items
Investments in shares and participations
fair value determinable 127,589 20,955 25,245 17,661 25,220 15,537
fair value not determinable 2372 – 586 – 615 –
Long-term receivables and loans 28,646 29,095 32,432 32,860 30,581 29,066
Short-term receivables and loans 33,078 35,338 24,822 24,765 23,090 23,854
Marketable securities 9,568 9,603 13,514 13,399 16,707 16,659
Long-term loans and debts 40,670 41,792 54,130 56,903 53,123 55,244
Short-term loans 25,828 27,000 36,817 35,898 26,018 26,770
Off-balance-sheet items
Volvo Group outstanding derivative contracts
– commercial exposure (21) (1,306) (256) (1,200) 144 855
Volvo Group outstanding commodity contracts – – – – – 159
Volvo Group outstanding derivative contracts
– financial exposure 125 (1,873) (556) (425) 1,394 1,987
1Pertains mainly to Volvo’s holdings in Mitsubishi Motors Corporation 2000, and in Scania AB 2000–2002.
2No single investment represents any significant amount.
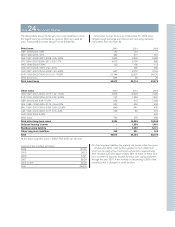
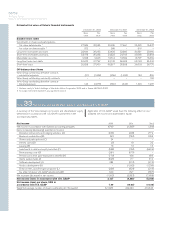
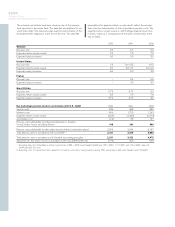
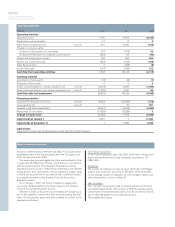
Note 33Net income and shareholders’ equity in accordance with U.S. GAAP
A summary of the Volvo Group’s net income and shareholders’ equity
determined in accordance with U.S. GAAP, is presented in the
accompanying tables.
Application of U.S. GAAP would have the following effect on con-
solidated net income and shareholders’ equity:
Net income 2000 2001 2002
Net income in accordance with Swedish accounting principles 4,709 (1,467) 1,393
Items increasing (decreasing) reported net income
Derivative instruments and hedging activities (A) (654) (298) 1,772
Business combinations (B) (91) (744) 1,094
Shares and participations (C) 24 – –
Interest costs (D) (3) 18 22
Leasing (E) 16 13 15
Investments in debt and equity securities (F) (548) (153) (9,616)
Restructuring costs (G) (281) (579) –
Pensions and other post-employment benefits (H) (170) 456 669
Alecta surplus funds (I) (523) 111 410
Software development (J) 384 (212) (212)
Product development (K) – (1,962) (1,236)
Entrance fees, aircraft engine programs (L) (336) (324) (219)
Tax effect of above U.S. GAAP adjustments (M) 600 821 (357)
Net increase (decrease) in net income (1,582) (2,853) (7,658)
Net income (loss) in accordance with U.S. GAAP 3,127 (4,320) (6,265)
Net income (loss) per share, SEK in
accordance with U.S. GAAP 7.40 (10.20) (14.90)
Weighted average number of shares outstanding (in thousands) 421,684 422,429 419,445