Volvo 2002 Annual Report Download - page 64
Download and view the complete annual report
Please find page 64 of the 2002 Volvo annual report below. You can navigate through the pages in the report by either clicking on the pages listed below, or by using the keyword search tool below to find specific information within the annual report.-
 1
1 -
2
-
3
-
4
-
5
-
6
-
7
-
8
-
9
-
10
-
11
-
12
-
13
-
14
-
15
-
16
-
17
-
18
-
19
-
20
-
21
-
22
-
23
-
24
-
25
-
26
-
27
-
28
-
29
-
30
-
31
-
32
-
33
-
34
-
35
-
36
-
37
-
38
-
39
-
40
-
41
-
42
-
43
-
44
-
45
-
46
-
47
-
48
-
49
-
50
-
51
-
52
-
53
-
 54
54 -
 55
55 -
 56
56 -
 57
57 -
 58
58 -
 59
59 -
 60
60 -
 61
61 -
 62
62 -
 63
63 -
 64
64 -
 65
65 -
 66
66 -
 67
67 -
 68
68 -
 69
69 -
 70
70 -
 71
71 -
 72
72 -
 73
73 -
 74
74 -
75
-
76
-
77
-
78
-
79
-
80
-
81
-
82
-
83
-
84
-
85
-
86
-
87
-
88
-
89
-
90
-
91
-
92
-
93
-
94
-
95
-
96
 |
 |

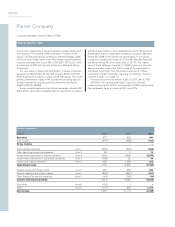
62/63
The Volvo Group
Notes to consolidated financial statements
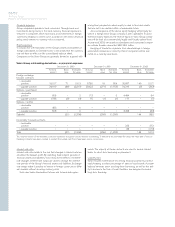
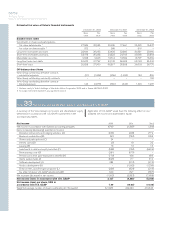
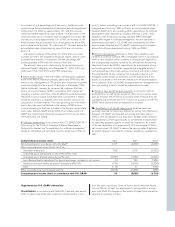
Net periodical pension costs in accordance with U.S. GAAP 2000 2001 2002
Service costs 339 468 480
Interest costs 406 1,273 1,263
Expected return on plan assets (535) (1,435) (1,214)
Amortization, net (12) 36 137
Pension costs attributable to defined benefit plans in Sweden,
United States, France and Great Britain 198 342 666
Pension costs attributable to other plans (mainly defined contribution plans) 2,203 2,534 3,137
Total pension costs in accordance with U.S. GAAP 1, 2 2,401 2,876 3,803
Total pension costs in accordance with Swedish accounting principles 1, 2 2,231 3,332 4,472
Adjustment of this year’s income in accordance with U.S. GAAP, before tax (170) 456 669
1Excluding deduction attributable to Alecta surplus funds of 683 in 2000 under Swedish GAAP and 160 in 2000, 111 in 2001 and 410 in 2002 under U.S.
GAAP. See (I) in this note.
2Excluding costs for special termination benefits in connection with restructuring measures during 2001 amounting to 402 under Swedish and U.S. GAAP.
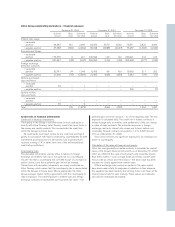
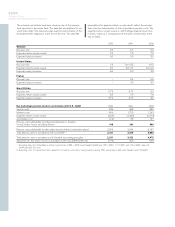
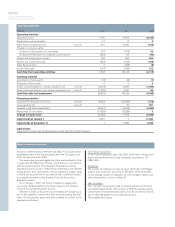
2000 2001 2002
Sweden
Discount rate 5.5 5.5 5.5
Expected return on plan assets 7.0 7.0 7.0
Expected salary increases 3.0 3.0 3.0
United States
Discount rate 7.5 7.0–7.25 6.75
Expected return on plan assets 9.0 9.0–9.5 9.0–9.5
Expected salary increases 6.0 5.0 3.5
France
Discount rate –5.5 5.5
Expected salary increases – 3.0 3.0
Great Britain
Discount rate 5.75 5.75 5.5
Expected return on plan assets 6.5 7.0 7.0
Expected salary increases 3.75 3.75 3.5
The actuarial calculations have been made by use of the assump-
tions specified in the below table. The specified assumptions for dis-
count rates reflect the discounts rates used for determination of the
projected benefit obligations at the end of the year. The specified
assumptions for expected return on plan assets reflect the assump-
tions used for determination of the net periodical pension costs. The
expected return on plan assets in 2003 will generally be lower than
in 2002, mainly as a consequence of the lower interest rates at the
end of 2002.