Volvo 2002 Annual Report Download - page 6
Download and view the complete annual report
Please find page 6 of the 2002 Volvo annual report below. You can navigate through the pages in the report by either clicking on the pages listed below, or by using the keyword search tool below to find specific information within the annual report.-
 1
1 -
 2
2 -
 3
3 -
 4
4 -
 5
5 -
 6
6 -
 7
7 -
 8
8 -
 9
9 -
 10
10 -
 11
11 -
 12
12 -
 13
13 -
 14
14 -
 15
15 -
 16
16 -
 17
17 -
18
-
19
-
20
-
21
-
22
-
23
-
24
-
25
-
26
-
27
-
28
-
29
-
30
-
31
-
32
-
33
-
34
-
35
-
36
-
37
-
38
-
39
-
40
-
41
-
42
-
43
-
44
-
45
-
46
-
47
-
48
-
49
-
50
-
51
-
52
-
53
-
54
-
55
-
56
-
57
-
58
-
59
-
60
-
61
-
62
-
63
-
64
-
65
-
66
-
67
-
68
-
69
-
70
-
71
-
72
-
73
-
74
-
75
-
76
-
77
-
78
-
79
-
80
-
81
-
82
-
83
-
84
-
85
-
86
-
87
-
88
-
89
-
90
-
91
-
92
-
93
-
94
-
95
-
96
 |
 |

04/05
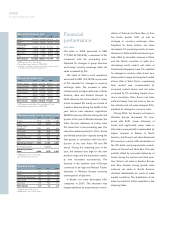
The Volvo Group year 2002
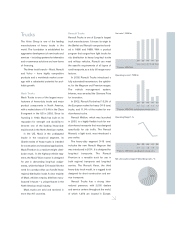
Net sales by market area
SEKM 200012001 2002 %2
Western Europe 61,942 93,147 92,331 (1)
Eastern Europe 3,676 6,383 7,437 +17
North America 38,029 54,630 50,206 (8)
South America 4,730 6,018 4,667 (22)
Asia 8,765 10,862 12,644 +16
Other markets 3,250 9,575 9,795 +2
Volvo Group 120,392 180,615 177,080 (2)
12000 figures exclude Mack Trucks and Renault Trucks.
2Percentage change pertains to 2002/2001.
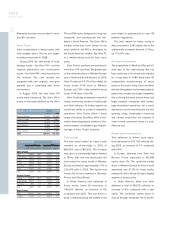
Net sales by business area
SEKM 2000 2001 2002 %2
Trucks159,075 116,568 118,752 +2
Buses 17,187 16,675 14,035 (16)
Construction
Equipment 19,993 21,135 21,012 (1)
Volvo Penta 6,599 7,380 7,669 +4
Volvo Aero 10,713 11,784 8,837 (25)
Other 6,825 7,073 6,775 (4)
Volvo Group 3120,392 180,615 177,080 (2)
12000 figures refer to Volvo Trucks.
2Percentage change pertains to 2002/2001.
3Adjusted for changes in group structure and foreign currency
exchange rates, net sales increased by 2%.
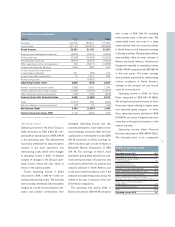
Operating margin 1
%2000 2001 2002
Trucks 22.4 0.9 1.0
Buses 2.6 (3.1) (0.7)
Construction Equipment 8.0 4.2 1.9
Volvo Penta 7.3 8.9 8.4
Volvo Aero 5.8 5.5 0.1
Volvo Group 5.5 1.8 1.6
1Excluding restructuring costs.
22000 figures refer to Volvo Trucks.
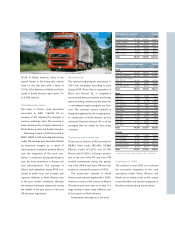
Operating income (loss) by business area
SEKM 2000 2001 2002
Trucks 11.414 1.040 1,189
Buses 440 (524) (94)
Construction
Equipment 1,594 891 406
Volvo Penta 484 658 647
Volvo Aero 621 653 5
Financial Services 1,499 325 490
Other 616 143 194
Operating income 26,668 3,186 2,837
Restructuring costs – (3,862) –
Operating income
(loss) 6,668 (676) 2,837
1 2000 figures refer to Volvo Trucks.
2 Excluding restructuring costs.
Financial
performance
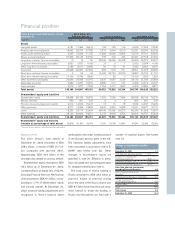
Net sales
Net sales in 2002 amounted to SEK
177,080 M (180,615), a decrease of 2%
compared with the preceding year.
Adjusted for changes in group structure
and foreign currency exchange rates, net
sales increased by 2%.
Net sales of Volvo’s truck operations
amounted to SEK 118,752 M, an increase
of 5% adjusted for changes in currency
exchange rates. The increase in sales
related mainly to higher deliveries in North
America, Asia and Eastern Europe. In
North America, the total market for heavy
trucks increased 5% mainly as a result of
a peak in demand during the middle of the
year before new emission regulations
(EPA02) became effective during the last
quarter of the year. In Western Europe, the
Volvo Group’s deliveries of trucks were
3% lower than in the preceding year. The
reduction related primarily to Volvo Trucks
and limited production capacity during the
first quarter in connection with the intro-
duction of the new Volvo FH and FM
series. During the remaining part of the
year, the demand was high for the new
product range and the production capaci-
ty was increased successively. The
demand in the southern part of Europe
continued to be high and Renault Trucks’
deliveries in Western Europe remained
unchanged at a high level.
In Buses, net sales decreased 16%
compared to 2001. The decrease was
largely explained by proportionate consol-
idation of Prévost and Nova Bus as from
the fourth quarter 2001 as well as
changes in currency exchange rates.
Adjusted for these effects, net sales
decreased 1% pertaining mainly to lower
deliveries in North and South America par-
tially offset by favorable volumes in China
and the Nordic countries. In spite of a
decreasing world market, net sales of
Construction Equipment rose 3%, adjusted
for changes in currency rates, driven by a
wider product range and improved market
shares. Also in Volvo Penta, a weakening
total market was compensated by
increased market shares and net sales
increased by 7% excluding impact of cur-
rency translation. Volvo Aero’s net sales
suffered heavily from the crisis in the air-
line industry and net sales dropped 23%,
adjusted for changes in currency rates.
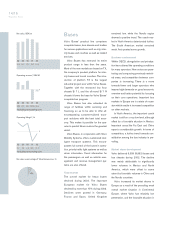
During 2002, the Group’s net sales in
Western Europe decreased 1% com-
pared with 2001. Lower deliveries of
trucks and significantly lower sales in
Volvo Aero were partially compensated by
higher volumes of Buses. In North
America, the Group’s net sales decreased
8% mainly as a result of the devaluation of
the US dollar and proportionate consoli-
dation of Prévost and Nova Bus. This was
partially offset by increased deliveries of
trucks during the second and third quar-
ters. Volvo’s net sales in Eastern Europe
and Asia showed strong growth rates
whereas net sales in South America
declined substantially as result of weak
market conditions. The distribution of net
sales by market is further specified in the
adjoining table.